Xerox 2005 Annual Report Download - page 66
Download and view the complete annual report
Please find page 66 of the 2005 Xerox annual report below. You can navigate through the pages in the report by either clicking on the pages listed below, or by using the keyword search tool below to find specific information within the annual report.-
 1
1 -
2
-
3
-
4
-
5
-
6
-
7
-
8
-
9
-
10
-
11
-
12
-
13
-
14
-
15
-
16
-
17
-
18
-
19
-
20
-
21
-
22
-
23
-
24
-
25
-
26
-
27
-
28
-
29
-
30
-
31
-
32
-
33
-
34
-
35
-
36
-
37
-
38
-
39
-
40
-
41
-
42
-
43
-
44
-
45
-
46
-
47
-
48
-
49
-
50
-
51
-
52
-
53
-
54
-
55
-
 56
56 -
 57
57 -
 58
58 -
 59
59 -
 60
60 -
 61
61 -
 62
62 -
 63
63 -
 64
64 -
 65
65 -
 66
66 -
 67
67 -
 68
68 -
 69
69 -
 70
70 -
 71
71 -
 72
72 -
 73
73 -
 74
74 -
 75
75 -
 76
76 -
77
-
78
-
79
-
80
-
81
-
82
-
83
-
84
-
85
-
86
-
87
-
88
-
89
-
90
-
91
-
92
-
93
-
94
-
95
-
96
-
97
-
98
-
99
-
100
-
101
-
102
-
103
-
104
-
105
-
106
-
107
-
108
-
109
-
110
-
111
-
112
-
113
-
114
 |
 |

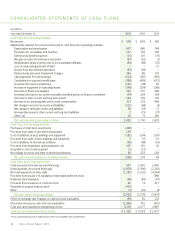
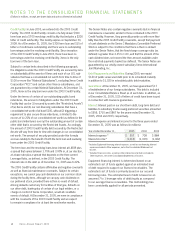
NOTES TO THE CONSOLIDATED FINANCIAL STATEMENTS
(Dollars in millions, except per-share data and unless otherwise indicated)
58
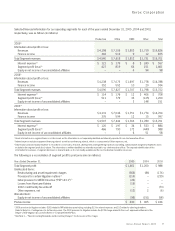
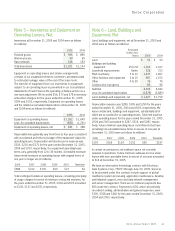
Geographic area data was as follows:
Revenues Long-Lived Assets(1)
(in millions) 2005 2004 2003 2005 2004 2003
United States $ 8,388 $ 8,346 $ 8,547 $ 1,386 $ 1,427 $ 1,477
Europe 5,226 5,281 4,863 500 585 616
Other Areas 2,087 2,095 2,291 386 434 460
Total $ 15,701 $ 15,722 $ 15,701 $2,272 $2,446 $2,553
(1) Long-lived assets are comprised of (i) land, buildings and equipment, net, (ii) equipment on operating leases, net, (iii) internal use software, net and (iv) capitalized software
costs, net.
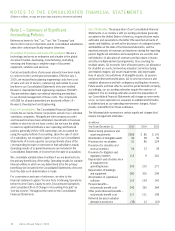
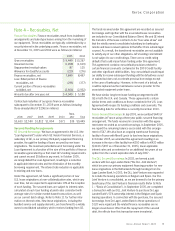
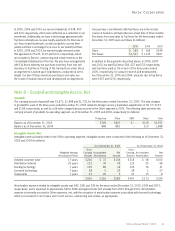
component of Common shareholders’ equity. The purchases
of Short-term investments for the year-ending December 31,
2005 were $386, including $2 of premiums which are amortized
as an offset to Interest income over the remaining term of the
investments. The cost of securities sold is based on the specific
identification method. Proceeds from sales of Short-term
investments for the year ended December 31, 2005 were
$139. No gains or losses were realized on these sales.
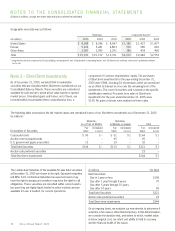
Note 3 – Short-Term Investments
As of December 31, 2005, we held $244 in marketable
securities that are classified within Short-term investments in our
Consolidated Balance Sheets. These securities are considered
available-for-sale and are carried at fair value based on quoted
market prices. Unrealized gains and losses, net of taxes, are
recorded within Accumulated other comprehensive loss, a
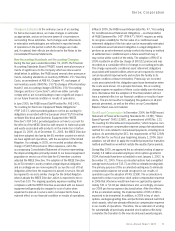
The following table summarizes the fair market values and unrealized losses of our Short-term investments as of December 31, 2005
(in millions):
Maturities Maturities
Less Than 12 Months 12 Months or Greater Total
Fair Unrealized Fair Unrealized Fair Unrealized
Description of Securities Value Losses Value Losses Value Loses
Corporate bonds $ 93 $ – $ 51 $ 1 $144 $ 1
Auction rate municipal bonds ––45–45–
U.S. government agency securities 13 – 19 – 32 –
Total Debt Securities $106 $ – $115 $ 1 $221 $ 1
Auction rate preferred securities 23 –
Total Short-term investments $244 $ 1
Xerox Annual Report 2005
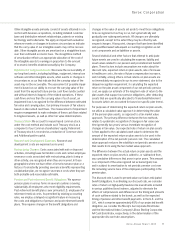
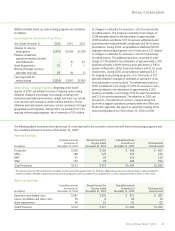
(in millions) Fair Value
Debt Securities:
Due in 1 year or less $106
Due after 1 year through 5 years 70
Due after 5 years through 10 years –
Due after 10 years 45
Total Debt Securities $221
Auction rate preferred securities 23
Total Short-term investments $244
On an ongoing basis, we evaluate our investments to determine if
adecline in fair value is other-than-temporary. In this determination,
we consider the duration that, and extent to which, market value
is below original cost, our intent and ability to hold to recovery
and the financial health of the issuer.
The contractual maturities of the available-for-sale debt securities
at December 31, 2005 are shown to the right. Expected maturities
will differ from contractual maturities because borrowers may
have the right to prepay and creditors may have the right to call
obligations. These securities are classified within current assets
because they are highly liquid, traded in active markets and are
available for use, if needed, for current operations.