Xerox 2005 Annual Report Download - page 43
Download and view the complete annual report
Please find page 43 of the 2005 Xerox annual report below. You can navigate through the pages in the report by either clicking on the pages listed below, or by using the keyword search tool below to find specific information within the annual report.-
 1
1 -
2
-
3
-
4
-
5
-
6
-
7
-
8
-
9
-
10
-
11
-
12
-
13
-
14
-
15
-
16
-
17
-
18
-
19
-
20
-
21
-
22
-
23
-
24
-
25
-
26
-
27
-
28
-
29
-
30
-
31
-
32
-
 33
33 -
 34
34 -
 35
35 -
 36
36 -
 37
37 -
 38
38 -
 39
39 -
 40
40 -
 41
41 -
 42
42 -
 43
43 -
 44
44 -
 45
45 -
 46
46 -
 47
47 -
 48
48 -
 49
49 -
 50
50 -
 51
51 -
 52
52 -
 53
53 -
54
-
55
-
56
-
57
-
58
-
59
-
60
-
61
-
62
-
63
-
64
-
65
-
66
-
67
-
68
-
69
-
70
-
71
-
72
-
73
-
74
-
75
-
76
-
77
-
78
-
79
-
80
-
81
-
82
-
83
-
84
-
85
-
86
-
87
-
88
-
89
-
90
-
91
-
92
-
93
-
94
-
95
-
96
-
97
-
98
-
99
-
100
-
101
-
102
-
103
-
104
-
105
-
106
-
107
-
108
-
109
-
110
-
111
-
112
-
113
-
114
 |
 |

Xerox Corporation
35
2004 operating loss improved by $315 million as compared
to 2003, principally due to:
•Reduced interest expense of $127 million.
•An increase in equity income from Fuji Xerox of $93 million.
•Gain on sale of our interest in ScanSoft of $38 million.
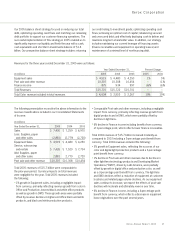
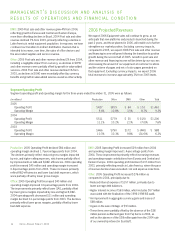
Gross Margins
Gross margins by revenue classification were as follows:
Year Ended December 31, 2005 2004 2003
Total gross margin 41.2% 41.6% 42.6%
Sales 36.6% 37.4% 37.6%
Service, outsourcing and rentals 43.3% 43.0% 44.3%
Finance income 62.7% 63.1% 63.7%
2005 Gross margin of 41.2% decreased 0.4-percentage points
from 2004, reflecting a decline in product mix of 1.3-percentage
points, reflecting a higher proportion of sales in office printer
and light production systems. Price declines of 1.5-percentage
points weremorethan offset by cost improvements of
2.3-percentage points.
2004 Gross margin of 41.6% declined 1.0-percentage points
from 2003. Approximately 0.8-percentage points of the decline
is due to product mix impacts from a greater proportion of lower
gross margin products in the Office and Production segments.
Approximately 0.6-percentage points of the decline reflects the
impact of DMO results. The decline in DMO results relates to
Brazil’s revenue, which has declined faster than declines in its
cost levels and a shift in product mix to lower gross margin products
in various DMO geographies. Productivity improvements essentially
offset the impact of lower prices.
2005 Sales gross margin of 36.6% decreased 0.8-percentage
points from 2004, driven by product mix declines of 1.5-percent-
age points. Price declines of 2.2-percentage points were more
than offset by cost improvements of 2.4-percentage points.
Product mix reflects a higher proportion of sales of products with
lower gross margins, including office printers and light production
systems, and a lower proportion of sales of products with higher
gross margins such as higher-end office black and white multi-
function devices and high-end production black and white systems.
2004 Sales gross margin of 37.4% decreased 0.2-percentage
points from 2003. Approximately 0.4-percentage points of the
decline results from product mix and DMO results contributed
0.6-percentage points to the decline. Additionally, productivity
improvements offset lower prices and other variances.
2005 Service, outsourcing and rentals gross margin of 43.3%
increased 0.3-percentage points driven by cost improvements
of 2.6-percentage points, which more than offset price
declines of 1.1-percentage points and product mix declines
of 0.9-percentage points.
2004 Service, outsourcing and rentals gross margin of 43.0%
declined 1.3-percentage points from 2003. The majority of the
decline is attributed to a change in product mix in the Office
and Production segments as well as DMO results. Productivity
and cost improvements offset lower prices for the year.
2005 Finance income gross margin of 62.7% declined 0.4-per-
centage points due to interest costs specific to equipment
financing. Equipment financing interest is determined based on
an estimated cost of funds, applied against an estimated level
of debt required to support our finance receivables. The esti-
mated cost of funds is primarily based on our secured borrowings
rates. The estimated level of debt is based on an assumed 7 to 1
leverage ratio of debt/equity as compared to our average finance
receivables. This methodology has been consistently applied for
all periods presented.
2004 Finance income gross margin decreased 0.6-percentage
points from 2003 due to interest costs specific to equipment
financing.
Research, development and engineering (“R,D&E”) of $943 million
in 2005 was $29 million higher than the prior year. Weexpect 2006
R,D&E spending to approximate 6% of total revenue in 2006.
Research and development (“R&D”) of $755 million in 2005
decreased from the prior year by $5 million. This period-over-
period comparison reflects lower expenditures in the Production
segment, which werepartially offset by increased spending in the
Office segment. The lower spending in the Production segment
was a result of recent product launches, and cost efficiencies
that we captured from our platform development strategy. We
invest in technological development, particularly in color, and
believe our R&D spending is sufficient to remain technologically
competitive. Our R&D is strategically coordinated with that of
Fuji Xerox, which invested $720 million and $704 million in R&D
in 2005 and 2004, respectively. 2004 R&D expense of $760
million was $108 million lower than the prior year, primarily
due to improved efficiencies as we captured benefits from our
platform development strategy as well as the commercial launch
of the Xerox iGen3.
Sustaining engineering costs of $188 million increased by
$34 million from the prior year, based on increases in year-over-
year product launches. Refer to Note 1 – “Basis of Presentation”
and Note 19 – Research, Development and Engineering in the
Consolidated Financial Statements for additional information.
On average, the reclassification of sustaining engineering costs
increased gross margins by approximately 1% for the year
ended 2005.
Xerox Annual Report 2005