Xerox 2005 Annual Report Download - page 56
Download and view the complete annual report
Please find page 56 of the 2005 Xerox annual report below. You can navigate through the pages in the report by either clicking on the pages listed below, or by using the keyword search tool below to find specific information within the annual report.-
 1
1 -
2
-
3
-
4
-
5
-
6
-
7
-
8
-
9
-
10
-
11
-
12
-
13
-
14
-
15
-
16
-
17
-
18
-
19
-
20
-
21
-
22
-
23
-
24
-
25
-
26
-
27
-
28
-
29
-
30
-
31
-
32
-
33
-
34
-
35
-
36
-
37
-
38
-
39
-
40
-
41
-
42
-
43
-
44
-
45
-
 46
46 -
 47
47 -
 48
48 -
 49
49 -
 50
50 -
 51
51 -
 52
52 -
 53
53 -
 54
54 -
 55
55 -
 56
56 -
 57
57 -
 58
58 -
 59
59 -
 60
60 -
 61
61 -
 62
62 -
 63
63 -
 64
64 -
 65
65 -
 66
66 -
67
-
68
-
69
-
70
-
71
-
72
-
73
-
74
-
75
-
76
-
77
-
78
-
79
-
80
-
81
-
82
-
83
-
84
-
85
-
86
-
87
-
88
-
89
-
90
-
91
-
92
-
93
-
94
-
95
-
96
-
97
-
98
-
99
-
100
-
101
-
102
-
103
-
104
-
105
-
106
-
107
-
108
-
109
-
110
-
111
-
112
-
113
-
114
 |
 |

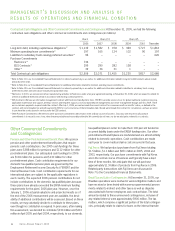
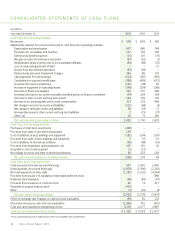
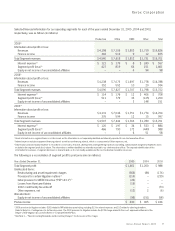
CONSOLIDATED STATEMENTS OF CASH FLOWS
48
(in millions)
Year ended December 31, 2005 2004 2003
Cash Flows from Operating Activities
Net income $ 978 $ 859 $ 360
Adjustments required to reconcile net income to cash flows from operating activities:
Depreciation and amortization 637 686 748
Provisions for receivables and inventory 107 159 302
Deferred tax (benefit) expense (15) 155 (70)
Net gain on sales of businesses and assets (97) (61) (1)
Undistributed equity in net income of unconsolidated affiliates (54) (89) (37)
Loss on early extinguishment of debt – – 73
Income from discontinued operations (53) (83) –
Restructuring and asset impairment charges 366 86 176
Cash payments for restructurings (214) (187) (345)
Contributions to pension benefit plans (388) (409) (672)
(Increase) decrease in inventories (162) (38) 62
Increase in equipment on operating leases (248) (234) (166)
Decrease in finance receivables 254 337 496
(Increase) decrease in accounts receivable and billed portion of finance receivables (34) 224 164
Decrease in other current and long-term assets 164 109 105
Increase in accounts payable and accrued compensation 313 333 408
Net change in income tax assets and liabilities (211) (68) (3)
Net change in derivative assets and liabilities 38 (23) 71
Increase (decrease) in other current and long-term liabilities 7 (79) (37)
Other,net 32 73 245
Net cash provided by operating activities 1,420 1,750 1,879
Cash Flows from Investing Activities
Purchases of short-term investments (386) ––
Proceeds from sales of short-term investments 139 – –
Cost of additions to land, buildings and equipment (181) (204) (197)
Proceeds from sales of land, buildings and equipment 5 53 10
Cost of additions to internal use software (56) (48) (53)
Proceeds from divestitures and investments, net 105 191 35
Acquisitions, net of cash acquired (1) (12) –
Net change in escrow and other restricted investments 80 223 254
Net cash (used in) provided by investing activities (295) 203 49
Cash Flows from Financing Activities
Cash proceeds from new secured financings 557 2,061 2,450
Debt payments on secured financings (1,879) (1,906) (2,181)
Net cash payments on other debt (1,187) (1,422) (4,044)
Proceeds from issuance of mandatory redeemable preferred stock – – 889
Preferred stock dividends (58) (83) (57)
Proceeds from issuances of common stock 40 73 477
Payments to acquiretreasury stock (433) – –
Other (2) (16) (4)
Net cash used in financing activities (2,962) (1,293) (2,470)
Effect of exchange rate changes on cash and cash equivalents (59) 81 132
(Decrease) increase in cash and cash equivalents (1,896) 741 (410)
Cash and cash equivalents at beginning of year 3,218 2,477 2,887
Cash and cash equivalents at end of year $ 1,322 $ 3,218 $ 2,477
The accompanying notes are an integral part of these Consolidated Financial Statements.
Xerox Annual Report 2005