Xerox 2005 Annual Report Download - page 110
Download and view the complete annual report
Please find page 110 of the 2005 Xerox annual report below. You can navigate through the pages in the report by either clicking on the pages listed below, or by using the keyword search tool below to find specific information within the annual report.-
 1
1 -
2
-
3
-
4
-
5
-
6
-
7
-
8
-
9
-
10
-
11
-
12
-
13
-
14
-
15
-
16
-
17
-
18
-
19
-
20
-
21
-
22
-
23
-
24
-
25
-
26
-
27
-
28
-
29
-
30
-
31
-
32
-
33
-
34
-
35
-
36
-
37
-
38
-
39
-
40
-
41
-
42
-
43
-
44
-
45
-
46
-
47
-
48
-
49
-
50
-
51
-
52
-
53
-
54
-
55
-
56
-
57
-
58
-
59
-
60
-
61
-
62
-
63
-
64
-
65
-
66
-
67
-
68
-
69
-
70
-
71
-
72
-
73
-
74
-
75
-
76
-
77
-
78
-
79
-
80
-
81
-
82
-
83
-
84
-
85
-
86
-
87
-
88
-
89
-
90
-
91
-
92
-
93
-
94
-
95
-
96
-
97
-
98
-
99
-
 100
100 -
 101
101 -
 102
102 -
 103
103 -
 104
104 -
 105
105 -
 106
106 -
 107
107 -
 108
108 -
 109
109 -
 110
110 -
 111
111 -
 112
112 -
 113
113 -
 114
114
 |
 |

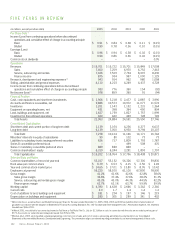
FIVE YEARS IN REVIEW
102
(in millions, except per-share data) 2005 2004 2003 2002 2001
Per-Share Data (1)
Income (Loss) from continuing operations before discontinued
operations and cumulative effect of change in accounting principle
Basic $ 0.91 $ 0.84 $ 0.38 $ 0.11 $ (0.15)
Diluted 0.90 0.78 0.36 0.10 (0.15)
Earnings (Loss)
Basic $ 0.96 $ 0.94 $ 0.38 $ 0.02 $ (0.15)
Diluted 0.94 0.86 0.36 0.02 (0.15)
Common stock dividends – – – – 0.05
Operations
Revenues $ 15,701 $ 15,722 $ 15,701 $ 15,849 $ 17,008
Sales 7,400 7,259 6,970 6,752 7,443
Service, outsourcing and rentals 7,426 7,529 7,734 8,097 8,436
Finance income 875 934 997 1,000 1,129
Research, development and engineering expenses(3) 943 914 962 980 1,058
Selling, administrative and general expenses 4,110 4,203 4,249 4,437 4,728
Income (Loss) from continuing operations before discontinued
operations and cumulative effect of change in accounting principle 933 776 360 154 (92)
Net income (loss)(1) 978 859 360 91 (94)
Financial Position
Cash, cash equivalents and short-term investments $ 1,566 $ 3,218 $ 2,477 $ 2,887 $ 3,990
Accounts and finance receivables, net 9,886 10,573 10,972 11,077 11,574
Inventories 1,201 1,143 1,152 1,231 1,364
Equipment on operating leases, net 431 398 364 450 804
Land, buildings and equipment, net 1,627 1,759 1,827 1,757 1,999
Investment in discontinued operations 420 440 449 728 749
Total Assets 21,953 24,884 24,591 25,550 27,746
Consolidated Capitalization
Short-term debt and current portion of long-term debt 1,139 3,074 4,236 4,377 6,637
Long-term debt 6,139 7,050 6,930 9,794 10,107
Total Debt 7,278 10,124 11,166 14,171 16,744
Minorities’ interests in equity of subsidiaries 90 80 102 73 73
Liabilities to subsidiary trusts issuing preferred securities 626 717 1,809 1,793 1,787
Series B convertible preferred stock – – 499 508 470
Series C mandatory convertible preferred stock 889 889 889 – –
Common shareholders’ equity 6,319 6,244 3,291 1,893 1,797
Total Capitalization $ 15,202 $ 18,054 $ 17,756 $ 18,438 $ 20,871
Selected Data and Ratios
Common shareholders of record at year-end 53,017 55,152 56,326 57,300 59,830
Book value per common share $ 6.79 $ 6.53 $ 4.15 $ 2.56 $ 2.49
Year-end common stock market price $ 14.65 $ 17.01 $ 13.80 $ 8.05 $ 10.42
Employees at year-end 55,220 58,100 61,100 67,800 78,900
Gross margin 41.2% 41.6% 42.6% 42.8% 38.6%
Sales gross margin 36.6% 37.4% 37.6% 38.2% 31.3%
Service, outsourcing and rentals gross margin 43.3% 43.0% 44.3% 44.5% 42.2%
Finance gross margin 62.7% 63.1% 63.7% 59.9% 59.5%
Working capital $ 4,390 $ 4,628 $ 2,666 $ 3,242 $ 2,340
Current ratio 2.0 1.7 1.4 1.4 1.2
Cost of additions to land, buildings and equipment $ 181 $ 204 $ 197 $ 146 $ 219
Depreciation on buildings and equipment $ 280 $ 305 $ 299 $ 341 $ 402
(1) Net income (loss), as well as Basic and Diluted Earnings per Sharefor the years ended December 31, 2005, 2004, 2003 and 2002 exclude the effect of amortization of
goodwill in accordance with the adoption of Statement of Financial Accounting Standards No. 142 “Goodwill and Other Intangible Assets.” Amortization expense, net, related to
Goodwill was $59 in 2001.
(2) In March 2001, we sold half of our ownership interest in Fuji Xerox to Fuji Photo Film Co. Ltd. for $1.3 billion in cash. In connection with the sale, we recorded a pre-tax gain of
$773. As a result, our ownership percentage decreased from 50% to 25%.
(3) Effective July 1, 2005, we reclassified sustaining engineering costs from cost of sales and cost of service, outsourcing and rentals to a new line item in our Consolidated
Statements of Income entitled Research, Development and Engineering. This presentation aligns our external reporting presentation to our internal management of these costs.
Xerox Annual Report 2005