Xerox 2005 Annual Report Download - page 35
Download and view the complete annual report
Please find page 35 of the 2005 Xerox annual report below. You can navigate through the pages in the report by either clicking on the pages listed below, or by using the keyword search tool below to find specific information within the annual report.-
 1
1 -
2
-
3
-
4
-
5
-
6
-
7
-
8
-
9
-
10
-
11
-
12
-
13
-
14
-
15
-
16
-
17
-
18
-
19
-
20
-
21
-
22
-
23
-
24
-
 25
25 -
 26
26 -
 27
27 -
 28
28 -
 29
29 -
 30
30 -
 31
31 -
 32
32 -
 33
33 -
 34
34 -
 35
35 -
 36
36 -
 37
37 -
 38
38 -
 39
39 -
 40
40 -
 41
41 -
 42
42 -
 43
43 -
 44
44 -
 45
45 -
46
-
47
-
48
-
49
-
50
-
51
-
52
-
53
-
54
-
55
-
56
-
57
-
58
-
59
-
60
-
61
-
62
-
63
-
64
-
65
-
66
-
67
-
68
-
69
-
70
-
71
-
72
-
73
-
74
-
75
-
76
-
77
-
78
-
79
-
80
-
81
-
82
-
83
-
84
-
85
-
86
-
87
-
88
-
89
-
90
-
91
-
92
-
93
-
94
-
95
-
96
-
97
-
98
-
99
-
100
-
101
-
102
-
103
-
104
-
105
-
106
-
107
-
108
-
109
-
110
-
111
-
112
-
113
-
114
 |
 |

Xerox Corporation
27
Our 2005 balance sheet strategy focused on reducing our total
debt, optimizing operating cash flows and matching our remaining
debt portfolio to support our customer financing operations. The
successful implementation of this strategy in 2005 enabled us to
significantly improve our liquidity and finish the year with a cash,
cash equivalents and short-term investments balance of $1.6
billion. Our prospective balance sheet strategy includes: returning
our credit rating to investment grade; optimizing operating cash
flows; achieving an optimal cost of capital; rebalancing secured
and unsecured debt; and effectively deploying cash to deliver and
maximize long-term shareholder value. In addition, our strategy
includes maintaining our current leverage of financing assets
(finance receivables and equipment on operating leases) and
maintenance of a minimal level of non-financing debt.
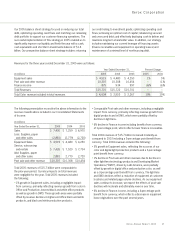
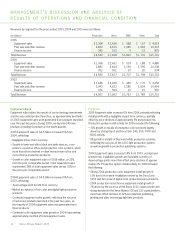
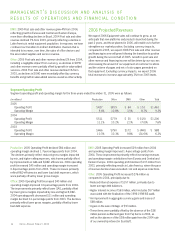
Revenues for the three years ended December 31, 2005 were as follows:
Year Ended December 31, Percent Change
(in millions) 2005 2004 2003 2005 2004
Equipment sales $ 4,519 $ 4,480 $ 4,250 1% 5%
Post sale and other revenue 10,307 10,308 10,454 – (1)%
Finance income 875 934 997 (6)% (6)%
Total Revenues $15,701 $15,722 $15,701 – –
Total Color revenue included in total revenues $ 4,634 $ 3,903 $ 3,267 19% 19%
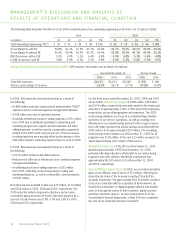
•Comparable Post sale and other revenues, including a negligible
impact from currency, primarily reflecting revenue growth from
digital products and in DMO, which were partially offset by
declines in light lens.
•6% decline in Finance income including benefits from currency
of 1-percentage point, which reflects lower finance receivables.
Total 2004 revenues of $15.7 billion increased modestly as
compared to 2003 including a 3-percentage point benefit from
currency. Total 2004 revenues included the following:
•5% growth in Equipment sales, reflecting the success of our
color and digital light production products and a 3-percentage
point benefit from currency.
•1% decline in Post sale and other revenues due to declines in
older light-lens technology products and Developing Market
Operations (“DMO”), driven by Latin America, were partially
offset by growth in digital office and production color, as well
as a 3-percentage point benefit from currency. The light-lens
and DMO declines reflect a reduction of equipment at customer
locations and related page volume declines. As our equipment
sales continue to increase, we expect the effects of post sale
declines will moderate and ultimately reverse over time.
•6% decline in Finance income, including a 4-percentage point
benefit from currency, which reflects a decrease in equipment
lease originations over the past several years.
The following presentation reconciles the above information to the
revenue classifications included in our Consolidated Statements
of Income:
(in millions)
Year Ended December 31, 2005 2004 2003
Sales $ 7,400 $ 7,259 $ 6,970
Less: Supplies, paper
and other sales (2,881) (2,779) (2,720)
Equipment Sales $ 4,519 $ 4,480 $ 4,250
Service, outsourcing
and rentals $ 7,426 $ 7,529 $ 7,734
Add: Supplies, paper
and other sales 2,881 2,779 2,720
Post sale and other revenue $10,307 $10,308 $10,454
Total 2005 revenues of $15.7 billion were comparable to
the prior-year period. Currency impacts on total revenues
were negligible for the year. Total 2005 revenues included
the following:
•1% growth in Equipment sales, including a negligible impact
from currency, primarily reflecting revenue growth from color in
Office and Production, low-end black and white office products
as well as growth in DMO. These growth areas were partially
offset by revenue declines in higher-end office black and white
products, and black and white production products.
Xerox Annual Report 2005