Xerox 2005 Annual Report Download - page 104
Download and view the complete annual report
Please find page 104 of the 2005 Xerox annual report below. You can navigate through the pages in the report by either clicking on the pages listed below, or by using the keyword search tool below to find specific information within the annual report.-
 1
1 -
2
-
3
-
4
-
5
-
6
-
7
-
8
-
9
-
10
-
11
-
12
-
13
-
14
-
15
-
16
-
17
-
18
-
19
-
20
-
21
-
22
-
23
-
24
-
25
-
26
-
27
-
28
-
29
-
30
-
31
-
32
-
33
-
34
-
35
-
36
-
37
-
38
-
39
-
40
-
41
-
42
-
43
-
44
-
45
-
46
-
47
-
48
-
49
-
50
-
51
-
52
-
53
-
54
-
55
-
56
-
57
-
58
-
59
-
60
-
61
-
62
-
63
-
64
-
65
-
66
-
67
-
68
-
69
-
70
-
71
-
72
-
73
-
74
-
75
-
76
-
77
-
78
-
79
-
80
-
81
-
82
-
83
-
84
-
85
-
86
-
87
-
88
-
89
-
90
-
91
-
92
-
93
-
 94
94 -
 95
95 -
 96
96 -
 97
97 -
 98
98 -
 99
99 -
 100
100 -
 101
101 -
 102
102 -
 103
103 -
 104
104 -
 105
105 -
 106
106 -
 107
107 -
 108
108 -
 109
109 -
 110
110 -
 111
111 -
 112
112 -
 113
113 -
 114
114
 |
 |

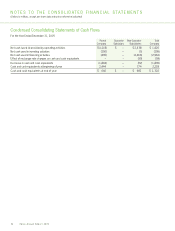
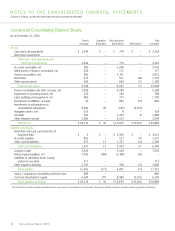
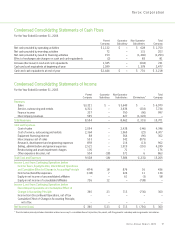
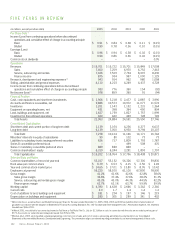
NOTES TO THE CONSOLIDATED FINANCIAL STATEMENTS
(Dollars in millions, except per-share data and unless otherwise indicated)
96
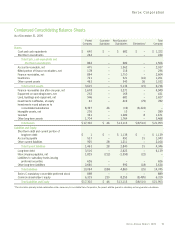
Condensed Consolidating Balance Sheets
As of December 31, 2004
Parent Guarantor Non-Guarantor Total
Company Subsidiary Subsidiaries Eliminations* Company
Assets
Cash and cash equivalents $ 2,444 $ – $ 774 $ – $ 3,218
Short-term investments – – – – –
Total Cash, cash equivalents and
Short-term investments 2,444 – 774 – 3,218
Accounts receivable, net 380 – 1,696 – 2,076
Billed portion of finance receivables, net 206 – 171 – 377
Finance receivables, net 581 – 2,351 – 2,932
Inventories 672 – 511 (40) 1,143
Other current assets 465 – 664 53 1,182
Total Current assets 4,748 – 6,167 13 10,928
Finance receivables due after one year,net 1,099 – 4,089 – 5,188
Equipment on operating leases, net 232 – 166 – 398
Land, buildings and equipment, net 982 – 777 – 1,759
Investments in affiliates, at equity 40 – 862 (57) 845
Investments in and advances to
consolidated subsidiaries 9,294 36 (165) (9,165) –
Intangible assets, net 316 – 8 – 324
Goodwill 381 – 1,459 8 1,848
Other long-term assets 1,082 – 2,512 – 3,594
Total Assets $ 18,174 $ 36 $ 15,875 $ (9,201) $ 24,884
Liabilities and Equity
Short-term debt and current portion of
long-term debt $ 5 $ – $ 3,069 $ – $ 3,074
Accounts payable 481 – 517 39 1,037
Other current liabilities 871 13 1,317 (12) 2,189
Total Current liabilities 1,357 13 4,903 27 6,300
Long-term debt 3,632 – 3,418 – 7,050
Intercompany payables, net 2,592 (184) (2,386) (22) –
Liabilities to subsidiary trusts issuing
preferred securities 717 – – – 717
Other long-term liabilities 2,743 – 956 (15) 3,684
Total Liabilities 11,041 (171) 6,891 (10) 17,751
Series C mandatory convertible preferred stock 889 – – – 889
Common shareholders’ equity 6,244 207 8,984 (9,191) 6,244
Total Liabilities and Equity $ 18,174 $ 36 $15,875 $ (9,201) $24,884
*The information primarily includes elimination entries necessary to consolidate Xerox Corporation, the parent, with the guarantor subsidiary and non-guarantor subsidiaries.
Xerox Annual Report 2005