Xerox 2005 Annual Report Download - page 47
Download and view the complete annual report
Please find page 47 of the 2005 Xerox annual report below. You can navigate through the pages in the report by either clicking on the pages listed below, or by using the keyword search tool below to find specific information within the annual report.-
 1
1 -
2
-
3
-
4
-
5
-
6
-
7
-
8
-
9
-
10
-
11
-
12
-
13
-
14
-
15
-
16
-
17
-
18
-
19
-
20
-
21
-
22
-
23
-
24
-
25
-
26
-
27
-
28
-
29
-
30
-
31
-
32
-
33
-
34
-
35
-
36
-
 37
37 -
 38
38 -
 39
39 -
 40
40 -
 41
41 -
 42
42 -
 43
43 -
 44
44 -
 45
45 -
 46
46 -
 47
47 -
 48
48 -
 49
49 -
 50
50 -
 51
51 -
 52
52 -
 53
53 -
 54
54 -
 55
55 -
 56
56 -
 57
57 -
58
-
59
-
60
-
61
-
62
-
63
-
64
-
65
-
66
-
67
-
68
-
69
-
70
-
71
-
72
-
73
-
74
-
75
-
76
-
77
-
78
-
79
-
80
-
81
-
82
-
83
-
84
-
85
-
86
-
87
-
88
-
89
-
90
-
91
-
92
-
93
-
94
-
95
-
96
-
97
-
98
-
99
-
100
-
101
-
102
-
103
-
104
-
105
-
106
-
107
-
108
-
109
-
110
-
111
-
112
-
113
-
114
 |
 |

Xerox Corporation
39
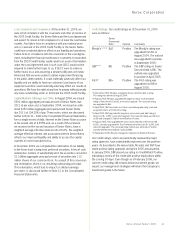
Equity in net income of unconsolidated affiliates increased
$93 million in 2004 as compared to 2003, reflecting:
•$38 million related to our share of a pension settlement gain
recorded by Fuji Xerox subsequent to a transfer of a portion
of their pension obligation to the Japanese government in
accordance with the Japan Welfare Pension Insurance Law.
•The remainder of the 2004 increase is primarily due to the
improved operational performance of Fuji Xerox.
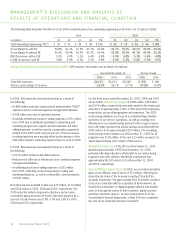
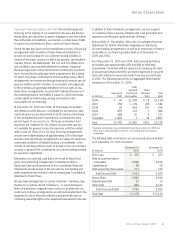
Income from Discontinued Operations: Income from discontinued
operations, net of tax, for the years ended December 31, 2005
and 2004 was as follows (in millions):
2005 2004 2003
Insurance Group Operations
tax benefits $53 $ – $ –
Gain on sale of ContentGuard,
net of income taxes of $26 – 83 –
Total $53 $ 83 $ –
As disclosed in Note 15 – Income and Other Taxes, in June 2005
we received notice that our 1996-1998 Internal Revenue Service
(“IRS”) audit was finalized. Of the total tax benefits realized,
including the reversal of existing reserves, $53 million was
attributed to our discontinued operations.
In the first quarter 2004, we sold all but 2% of our 75% ownership
interest in ContentGuard Inc. (“ContentGuard”) to Microsoft
Corporation and Time Warner Inc. for $66 million in cash. The
sale resulted in an after-tax gain of approximately $83 million
($109 million pre-tax) and reflects our recognition of cumulative
operating losses. The revenues, operating results and net assets
of ContentGuard were immaterial for all periods presented.
ContentGuard, which was originally created out of research
developed at the Xerox Palo Alto Research Center (“PARC”),
licenses intellectual property and technologies related to digital
rights management. During 2005, we sold our remaining interest
in ContentGuard.
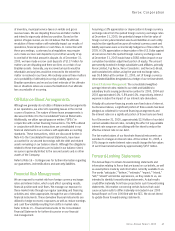
Recent Accounting Pronouncements: Refer to Note 1 of the
Consolidated Financial Statements for a description of recent
accounting pronouncements including the respective dates of
adoption and effects on results of operations and financial condition.
Xerox Annual Report 2005
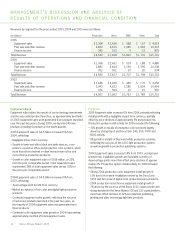
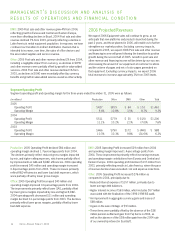
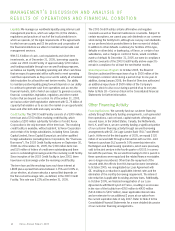
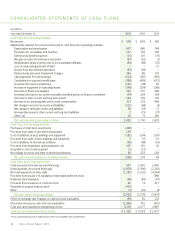
Capital Resources and Liquidity
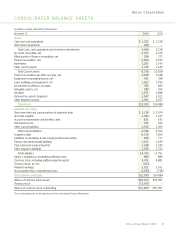
Cash Flow Analysis: The following summarizes our cash flows for each of the three years ended December 31, 2005, as reported in our
Consolidated Statements of Cash Flows in the accompanying Consolidated Financial Statements:
2005 2004
Amount Amount
(in millions) 2005 2004 2003 Change Change
Net cash provided by operating activities $ 1,420 $ 1,750 $ 1,879 $ (330) $ (129)
Net cash (used in) provided by investing activities (295) 203 49 (498) 154
Net cash used in financing activities (2,962) (1,293) (2,470) (1,669) 1,177
Effect of exchange rate changes on cash and cash equivalents (59) 81 132 (140) (51)
(Decrease) increase in cash and cash equivalents (1,896) 741 (410) (2,637) 1,151
Cash and cash equivalents at beginning of period 3,218 2,477 2,887 741 (410)
Cash and cash equivalents at end of period $ 1,322 $ 3,218 $ 2,477 $(1,896) $ 741
Cash, cash equivalents and short-term investments reported in
our Consolidated Financial Statements wereas follows:
December 31, 2005 2004
Cash and cash equivalents $ 1,322 $ 3,218
Short-term investments 244 –
Total Cash, cash equivalents and
Short-term investments $ 1,566 $ 3,218
For the year ended December 31, 2005, net cash provided by
operating activities decreased $330 million from 2004, primarily
as a result of the following:
•$258 million decrease due to modest growth in accounts
receivable in 2005 compared to a decline in 2004.
•$83 million decrease due to lower finance receivable run-off.
•$124 million decrease due to higher inventory growth in
2005 compared to 2004, reflecting an increase in the number
of new products.