Xerox 2005 Annual Report Download - page 102
Download and view the complete annual report
Please find page 102 of the 2005 Xerox annual report below. You can navigate through the pages in the report by either clicking on the pages listed below, or by using the keyword search tool below to find specific information within the annual report.-
 1
1 -
2
-
3
-
4
-
5
-
6
-
7
-
8
-
9
-
10
-
11
-
12
-
13
-
14
-
15
-
16
-
17
-
18
-
19
-
20
-
21
-
22
-
23
-
24
-
25
-
26
-
27
-
28
-
29
-
30
-
31
-
32
-
33
-
34
-
35
-
36
-
37
-
38
-
39
-
40
-
41
-
42
-
43
-
44
-
45
-
46
-
47
-
48
-
49
-
50
-
51
-
52
-
53
-
54
-
55
-
56
-
57
-
58
-
59
-
60
-
61
-
62
-
63
-
64
-
65
-
66
-
67
-
68
-
69
-
70
-
71
-
72
-
73
-
74
-
75
-
76
-
77
-
78
-
79
-
80
-
81
-
82
-
83
-
84
-
85
-
86
-
87
-
88
-
89
-
90
-
91
-
 92
92 -
 93
93 -
 94
94 -
 95
95 -
 96
96 -
 97
97 -
 98
98 -
 99
99 -
 100
100 -
 101
101 -
 102
102 -
 103
103 -
 104
104 -
 105
105 -
 106
106 -
 107
107 -
 108
108 -
 109
109 -
 110
110 -
 111
111 -
 112
112 -
113
-
114
 |
 |

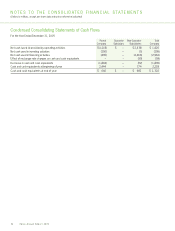
NOTES TO THE CONSOLIDATED FINANCIAL STATEMENTS
(Dollars in millions, except per-share data and unless otherwise indicated)
94
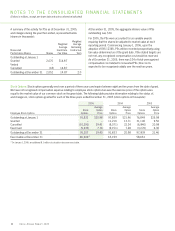
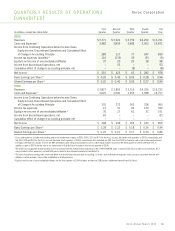
Condensed Consolidating Statements of Cash Flows
For the Year Ended December 31, 2005
Parent Guarantor Non-Guarantor Total
Company Subsidiary Subsidiaries Company
Net cash (used in) provided by operating activities $(1,018) $ – $ 2,438 $ 1,420
Net cash used in investing activities (290) – (5) (295)
Net cash used in financing activities (496) – (2,466) (2,962)
Effect of exchange rate changes on cash and cash equivalents – – (59) (59)
Decrease in cash and cash equivalents (1,804) – (92) (1,896)
Cash and cash equivalents at beginning of year 2,444 – 774 3,218
Cash and cash equivalents at end of year $ 640 $ – $ 682 $ 1,322
Xerox Annual Report 2005