Xerox 2005 Annual Report Download - page 42
Download and view the complete annual report
Please find page 42 of the 2005 Xerox annual report below. You can navigate through the pages in the report by either clicking on the pages listed below, or by using the keyword search tool below to find specific information within the annual report.-
 1
1 -
2
-
3
-
4
-
5
-
6
-
7
-
8
-
9
-
10
-
11
-
12
-
13
-
14
-
15
-
16
-
17
-
18
-
19
-
20
-
21
-
22
-
23
-
24
-
25
-
26
-
27
-
28
-
29
-
30
-
31
-
 32
32 -
 33
33 -
 34
34 -
 35
35 -
 36
36 -
 37
37 -
 38
38 -
 39
39 -
 40
40 -
 41
41 -
 42
42 -
 43
43 -
 44
44 -
 45
45 -
 46
46 -
 47
47 -
 48
48 -
 49
49 -
 50
50 -
 51
51 -
 52
52 -
53
-
54
-
55
-
56
-
57
-
58
-
59
-
60
-
61
-
62
-
63
-
64
-
65
-
66
-
67
-
68
-
69
-
70
-
71
-
72
-
73
-
74
-
75
-
76
-
77
-
78
-
79
-
80
-
81
-
82
-
83
-
84
-
85
-
86
-
87
-
88
-
89
-
90
-
91
-
92
-
93
-
94
-
95
-
96
-
97
-
98
-
99
-
100
-
101
-
102
-
103
-
104
-
105
-
106
-
107
-
108
-
109
-
110
-
111
-
112
-
113
-
114
 |
 |

MANAGEMENT’S DISCUSSION AND ANALYSIS OF
RESULTS OF OPERATIONS AND FINANCIAL CONDITION
34
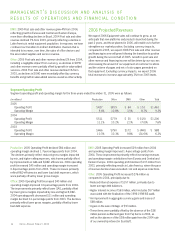
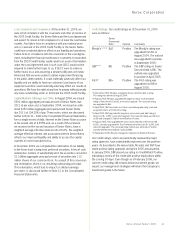
2006 Projected Revenues
We expect 2006 Equipment sales will continue to grow, as we
anticipate that new platforms and products launched during the
past 2 years, and those planned in 2006, will enable us to further
strengthen our market position. Excluding currency impacts,
compared to 2005, we expect 2006 Post sale and other revenue
and financing income will grow following the transition to positive
growth during the second half of 2005. Growth in post sale and
other revenue and financing income will be driven by our success
at increasing the amount of our equipment at customer locations
and the volume of pages and mix of color pages generated on
that equipment. Excluding currency impacts, we expect 2006
total revenues to increase approximately 3% from 2005 levels.
DMO: 2005 Post sale and other revenue grew 4% from 2004,
reflecting growth in Eurasia and Central and Eastern Europe,
more than offsetting declines in Brazil. 2004 Post sale and other
revenue declined 7% from 2003, primarily reflecting a decline in
Latin America’s rental equipment population. In response, we have
continued our transition to indirect distribution channels that is
intended to increase, over time, the sales of office devices and
the associated supplies and service revenue.
Other: 2005 Post sale and other revenue declined 2% from 2004,
including a negligible impact from currency, as declines in SOHO
and other revenues were partially offset by growth in value-added
services. 2004 Post sale and other revenue declined 1% from
2003, as declines in SOHO were essentially offset by currency
benefits and growth in value-added services as well as other activity.
Xerox Annual Report 2005
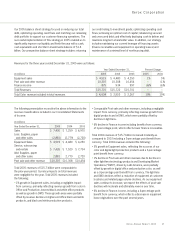
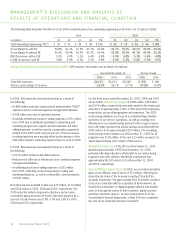
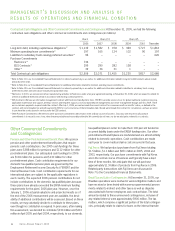
Segment Operating Profit
Segment operating profit and operating margin for the three years ended December 31, 2005 were as follows:
(in millions) Production Office DMO Other Total
2005
Operating Profit $427 $819 $ 64 $ 151 $1,461
Operating Margin 9.4% 10.8% 3.5% 8.7% 9.3%
2004
Operating Profit $511 $779 $ 35 $ (125) $1,200
Operating Margin 11.1% 10.2% 2.1% (7.0)% 7.6%
2003
Operating Profit $466 $790 $172 $ (440) $ 988
Operating Margin 10.3% 10.3% 9.8% (24.6)% 6.3%
Production: 2005 Operating Profit declined $84 million and
operating margin declined 1.7-percentage points from 2004.
The declines primarily reflect reduced gross margins impacted
by mix, and higher selling expenses, which were partially offset
by improvements in G&A and R,D&E efficiencies. 2004 operating
profit increased $45 million and operating margin increased
0.8-percentage points from 2003. These increases primarily
reflect R&D efficiencies and lower bad debt expenses, which
were partially offset by lower gross margin.
Office: 2005 Operating Profit increased $40 million and
operating margin improved 0.6-percentage points from 2004.
The improvements primarily reflect lower SAG, partially offset
by lower gross margins impacted by mix and higher R,D&E.
2004 operating profit decreased $11 million and operating
margin declined 0.1-percentage points from 2003. The declines
primarily reflect lower gross margins, partially offset by lower
bad debt expense.
DMO: 2005 Operating Profit increased $29 million from 2004
and operating margin improved 1.4-percentage points from
2004. These improvements primarily reflect increasing revenues
and operating margin contributions from Eurasia and Central and
Eastern Europe. 2004 operating profit declined $137 million from
2003, primarily reflecting results in Latin America, where the pace
of revenue declines have exceeded cost and expense reductions.
Other: 2005 Operating Profit increased $276 million as
compared to 2004, principally due to:
•Reduced interest expense of $157 million, primarily due to
lower average debt balances.
•Higher interest income of $63 million, which includes $57 million
associated with the finalization of the 1996-1998 IRS audit.
•An improvement in aggregate currency gains and losses of
$68 million.
•Again on the sale of Integic of $93 million.
•These items were partially offset by the absence of the $38
million pension settlement gain from Fuji Xerox in 2004, as
well as the absence of the $38 million gain from the 2004 sale
of our ownership interest in ScanSoft.