Xerox 2005 Annual Report Download - page 44
Download and view the complete annual report
Please find page 44 of the 2005 Xerox annual report below. You can navigate through the pages in the report by either clicking on the pages listed below, or by using the keyword search tool below to find specific information within the annual report.-
 1
1 -
2
-
3
-
4
-
5
-
6
-
7
-
8
-
9
-
10
-
11
-
12
-
13
-
14
-
15
-
16
-
17
-
18
-
19
-
20
-
21
-
22
-
23
-
24
-
25
-
26
-
27
-
28
-
29
-
30
-
31
-
32
-
33
-
 34
34 -
 35
35 -
 36
36 -
 37
37 -
 38
38 -
 39
39 -
 40
40 -
 41
41 -
 42
42 -
 43
43 -
 44
44 -
 45
45 -
 46
46 -
 47
47 -
 48
48 -
 49
49 -
 50
50 -
 51
51 -
 52
52 -
 53
53 -
 54
54 -
55
-
56
-
57
-
58
-
59
-
60
-
61
-
62
-
63
-
64
-
65
-
66
-
67
-
68
-
69
-
70
-
71
-
72
-
73
-
74
-
75
-
76
-
77
-
78
-
79
-
80
-
81
-
82
-
83
-
84
-
85
-
86
-
87
-
88
-
89
-
90
-
91
-
92
-
93
-
94
-
95
-
96
-
97
-
98
-
99
-
100
-
101
-
102
-
103
-
104
-
105
-
106
-
107
-
108
-
109
-
110
-
111
-
112
-
113
-
114
 |
 |

MANAGEMENT’S DISCUSSION AND ANALYSIS OF
RESULTS OF OPERATIONS AND FINANCIAL CONDITION
36
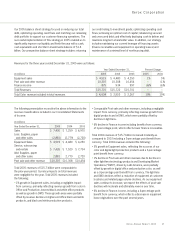
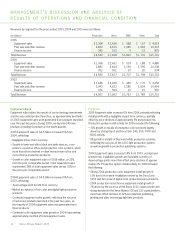
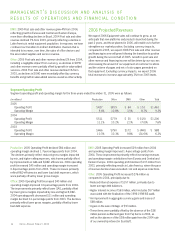
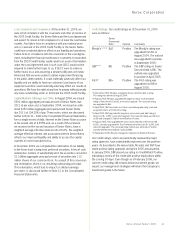
The following table illustrates the effects of our 2005 reclassification of our sustaining engineering costs from cost of sales to R,D&E:
2004 2005
(in millions) Q1 Q2 Q3 Q4 YTD Q1 Q2 Q3 Q4 YTD
Total Sustaining Engineering (“SE”) $ 30 $ 41 $ 45 $ 38 $ 154 $ 42 $ 54 $ 46 $ 46 $ 188
Gross Margin %, with SE 39.8% 41.3% 41.3% 40.1% 40.6% 40.7% 39.0% 40.1% 40.3% 40.0%
Gross Margin %, without SE 40.6% 42.4% 42.5% 41.0% 41.6% 41.8% 40.4% 41.3% 41.4% 41.2%
R&D % revenue, without SE 5.0% 4.9% 5.1% 4.4% 4.8% 4.9% 4.8% 5.2% 4.4% 4.8%
R,D&E % revenue, with SE 5.8% 5.9% 6.3% 5.3% 5.8% 6.0% 6.2% 6.4% 5.5% 6.0%
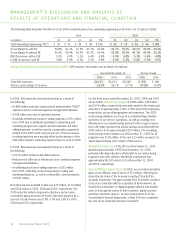
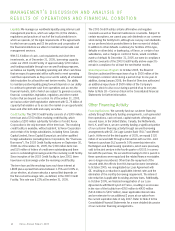
Selling, Administrative and General Expenses (“SAG”): SAG expense information was as follows (in millions):
Year Ended December 31, Amount Change
2005 2004 2003 2005 2004
Total SAG expenses $4,110 $4,203 $4,249 $ (93) $ (46)
SAG as a percentage of revenue 26.2% 26.7% 27.1% (0.5)% (0.4)%
In 2005, SAG expenses decreased primarily as a result of
the following:
•An $86 million reduction in general and administrative (“G&A”)
expenses due to continued expense management initiatives.
•A$38 million decrease in bad debt expense.
•Apartially offsetting increase in selling expenses of $31 million
from 2004 due to additional spending for advertising and
marketing programs to support product launches and other
selling expenses, as well as special compensation payments
related to the 2005 merit increase process. These increases
in selling expenses werepartially offset by the absence of the
$28 million Olympic marketing expense that occurred in 2004.
In 2004, SAG expenses decreased primarily as a result of
the following:
•A $114 million decline in bad debt expense.
•Reductions in G&A due to efficiencies from continued expense
management initiatives.
•An offsetting increase in selling expenses of $52 million
from 2003, reflecting increased spending in selling and
marketing initiatives, as well as unfavorable currency impacts
of $141 million.
Bad debt expense included in SAG was $72 million, $110 million
and $224 million in 2005, 2004 and 2003, respectively. The
2005 reduction reflects improved collections performance,
receivables aging and write-off trends. Bad debt expense as a
percent of total revenue was 0.5%, 0.7% and 1.4% for 2005,
2004 and 2003, respectively.
For the three years ended December 31, 2005, 2004 and 2003
we recorded restructuring charges of $366 million, $86 million
and $176 million, respectively,primarily related to the headcount
reductions of approximately 3,900, 1,900 and 2,000 employees,
respectively,across all geographies and segments. The 2005
restructuring initiatives are focused on implementing a flexible
workforce in our service operations, as well as creating cost
efficiencies in our manufacturing and back-office supportopera-
tions. Weexpect prospective annual savings associated with the
2005 actions to be approximately $290 million. The remaining
restructuring reserve balance as of December 31, 2005 for all
programs was $236 million. In the next 12 months, we expect to
spend approximately $212 million of this reserve.
Worldwide employment of 55,200 as of December 31, 2005
declined approximately 2,900 from December 31, 2004,
primarily reflecting reductions attributable to our restructuring
programs and other attrition. Worldwide employment was
approximately 58,100 and 61,100 at December 31, 2004
and 2003, respectively.
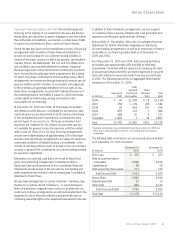
Gain on Affiliate’s Sale of Stock: In 2003, we recorded cumulative
gains on an affiliate’s sale of stock of $13 million, reflecting our
proportionate share of the increase in equity of ScanSoft Inc.,
an equity investment. The gain resulted from ScanSoft’s issuance
of stock in connection with its acquisition of Speechworks, Inc.
ScanSoft is a developer of digital imaging software that enables
users to leverage the power of their scanners, digital cameras
and other electronic devices. As discussed in Note 21 to the
Consolidated Financial Statements, in April 2004 we completed
the sale of our ownership interest in ScanSoft.
Xerox Annual Report 2005