Xcel Energy 2011 Annual Report Download - page 89
Download and view the complete annual report
Please find page 89 of the 2011 Xcel Energy annual report below. You can navigate through the pages in the report by either clicking on the pages listed below, or by using the keyword search tool below to find specific information within the annual report.-
 1
1 -
2
-
3
-
4
-
5
-
6
-
7
-
8
-
9
-
10
-
11
-
12
-
13
-
14
-
15
-
16
-
17
-
18
-
19
-
20
-
21
-
22
-
23
-
24
-
25
-
26
-
27
-
28
-
29
-
30
-
31
-
32
-
33
-
34
-
35
-
36
-
37
-
38
-
39
-
40
-
41
-
42
-
43
-
44
-
45
-
46
-
47
-
48
-
49
-
50
-
51
-
52
-
53
-
54
-
55
-
56
-
57
-
58
-
59
-
60
-
61
-
62
-
63
-
64
-
65
-
66
-
67
-
68
-
69
-
70
-
71
-
72
-
73
-
74
-
75
-
76
-
77
-
78
-
 79
79 -
 80
80 -
 81
81 -
 82
82 -
 83
83 -
 84
84 -
 85
85 -
 86
86 -
 87
87 -
 88
88 -
 89
89 -
 90
90 -
 91
91 -
 92
92 -
 93
93 -
 94
94 -
 95
95 -
 96
96 -
 97
97 -
 98
98 -
 99
99 -
100
-
101
-
102
-
103
-
104
-
105
-
106
-
107
-
108
-
109
-
110
-
111
-
112
-
113
-
114
-
115
-
116
-
117
-
118
-
119
-
120
-
121
-
122
-
123
-
124
-
125
-
126
-
127
-
128
-
129
-
130
-
131
-
132
-
133
-
134
-
135
-
136
-
137
-
138
-
139
-
140
-
141
-
142
-
143
-
144
-
145
-
146
-
147
-
148
-
149
-
150
-
151
-
152
-
153
-
154
-
155
-
156
-
157
-
158
-
159
-
160
-
161
-
162
-
163
-
164
-
165
 |
 |

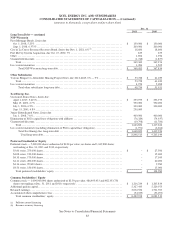
79
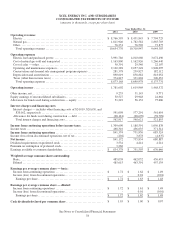
XCEL ENERGY INC. AND SUBSIDIARIES
CONSOLIDATED STATEMENTS OF CASH FLOWS
(amounts in thousands)
Year Ended Dec. 31
2011 2010 2009
Operating activities
Net income................................
..............................
$
841,172 $
755,834 $
680,887
Remove (income) loss from discontinued operations
...............................
202 (3,878) 4,637
Adjustments to reconcile net income to cash provided by operating activities:
Depreciation and amortization................................
..............
908,853 872,186 835,597
Conservation and demand side management program amortization
...................
9,816 21,700 29,418
Nuclear fuel amortization ................................
.................
100,902 105,369 80,104
Deferred income taxes ................................
...................
466,567 414,460 407,517
Amortization of investment tax credits................................
........
(6,194) (6,353) (6,426)
Allowance for equity funds used during construction
.............................
(51,223) (56,152) (75,686)
Equity earnings of unconsolidated subsidiaries................................
..
(30,527) (29,948) (24,664)
Dividends from unconsolidated subsidiaries................................
....
34,034 32,538 29,059
Provision for bad debts ................................
...................
44,521 44,068 49,023
Share-based compensation expense ................................
..........
45,006 35,807 29,672
Net derivative losses (gains) ................................
...............
9,966 (35,552) 39,029
Changes in operating assets and liabilities:................................
.....
Accounts receivable ................................
...................
(79,701) (29,749) 122,503
Accrued unbilled revenues ................................
..............
19,951 (14,642) 49,430
Inventories ................................
..........................
(57,432) 9,239 100,504
Other current assets ................................
...................
62,458 10,461 (84,783)
Accounts payable ................................
.....................
13,748 (188,855) (50,638)
Net regulatory assets and liabilities ................................
........
149,282 36,096 (38,403)
Other current liabilities ................................
.................
112,353 13,192 49,388
Pension and other employee benefit obligations
...............................
(150,717) (62,625) (245,987)
Change in other noncurrent assets ................................
...........
24,069 5,936 (1,991)
Change in other noncurrent liabilities................................
.........
(61,584) (35,190) (65,284)
Net cash provided by operating activities................................
..........
2,405,522 1,893,942 1,912,906
Investing activities
Utility capital/construction expenditures ................................
........
(2,205,567) (2,216,193) (1,777,608)
Allowance for equity funds used during construction
...............................
51,223 56,152 75,686
Merricourt refund ................................
.........................
101,261 - -
Merricourt deposit ................................
........................
(90,833) (1,134) (9,294)
Purchase of investments in external decommissioning fund
..........................
(2,098,642) (3,781,438) (1,644,278)
Proceeds from the sale of investments in external decommissioning fund
................
2,098,642 3,786,373 1,664,957
Proceeds from the sale of assets................................
...............
- 87,823 -
Acquisition of generation assets ................................
..............
- (732,495) -
Investment in WYCO Development LLC................................
........
(2,446) (8,046) (42,490)
Change in restricted cash................................
....................
(95,287) 89 264
Other, net ................................
...............................
(6,152) 2,145 (1,917)
Net cash used in investing activities................................
..............
(2,247,801) (2,806,724) (1,734,680)
Financing activities
(Repayments of) proceeds from short-term borrowings, net
..........................
(247,400) 7,400 3,750
Proceeds from issuance of long-term debt ................................
.......
688,598 1,433,406 689,915
Repayments of long-term debt, including reacquisition premiums
......................
(105,623) (560,383) (621,296)
Proceeds from issuance of common stock ................................
.......
38,691 457,258 20,133
Redemption of preferred stock................................
................
(104,980) - -
Dividends paid ................................
...........................
(474,760) (432,110) (414,922)
Net cash (used in) provided by financing activities ................................
...
(205,474) 905,571 (322,420)
Net change in cash and cash equivalents ................................
..........
(47,753) (7,211) (144,194)
Cash and cash equivalents at beginning of period ................................
....
108,437 115,648 259,842
Cash and cash equivalents at end of period................................
.........
$
60,684 $
108,437 $
115,648
Supplemental disclosure of cash flow information:
Cash paid for interest (net of amounts capitalized) ................................
.
$
(531,148) $
(530,072) $
(514,675)
Cash received (paid) for income taxes, net ................................
.......
55,764 (16,635) 21,154
Supplemental disclosure of non-cash investing and financing transactions:
Property, plant and equipment additions in accounts payable
.........................
$
137,558 $
174,903 $
68,417
Storage assets under capital lease ................................
.............
3,688 6,314 71,553
Issuance of common stock for reinvested dividends and 401(k) plans
...................
71,715 63,905 54,638
See Notes to Consolidated Financial Statements