Xcel Energy 2011 Annual Report Download - page 64
Download and view the complete annual report
Please find page 64 of the 2011 Xcel Energy annual report below. You can navigate through the pages in the report by either clicking on the pages listed below, or by using the keyword search tool below to find specific information within the annual report.-
 1
1 -
2
-
3
-
4
-
5
-
6
-
7
-
8
-
9
-
10
-
11
-
12
-
13
-
14
-
15
-
16
-
17
-
18
-
19
-
20
-
21
-
22
-
23
-
24
-
25
-
26
-
27
-
28
-
29
-
30
-
31
-
32
-
33
-
34
-
35
-
36
-
37
-
38
-
39
-
40
-
41
-
42
-
43
-
44
-
45
-
46
-
47
-
48
-
49
-
50
-
51
-
52
-
53
-
 54
54 -
 55
55 -
 56
56 -
 57
57 -
 58
58 -
 59
59 -
 60
60 -
 61
61 -
 62
62 -
 63
63 -
 64
64 -
 65
65 -
 66
66 -
 67
67 -
 68
68 -
 69
69 -
 70
70 -
 71
71 -
 72
72 -
 73
73 -
 74
74 -
75
-
76
-
77
-
78
-
79
-
80
-
81
-
82
-
83
-
84
-
85
-
86
-
87
-
88
-
89
-
90
-
91
-
92
-
93
-
94
-
95
-
96
-
97
-
98
-
99
-
100
-
101
-
102
-
103
-
104
-
105
-
106
-
107
-
108
-
109
-
110
-
111
-
112
-
113
-
114
-
115
-
116
-
117
-
118
-
119
-
120
-
121
-
122
-
123
-
124
-
125
-
126
-
127
-
128
-
129
-
130
-
131
-
132
-
133
-
134
-
135
-
136
-
137
-
138
-
139
-
140
-
141
-
142
-
143
-
144
-
145
-
146
-
147
-
148
-
149
-
150
-
151
-
152
-
153
-
154
-
155
-
156
-
157
-
158
-
159
-
160
-
161
-
162
-
163
-
164
-
165
 |
 |

54
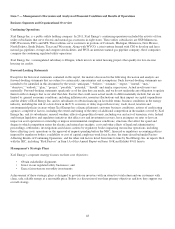
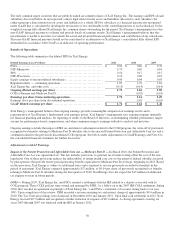
Degree-day or Temperature-Humidity Index (THI) data is used to estimate amounts of energy required to maintain comfortable
indoor temperature levels based on each day’s average temperature and humidity. Heating degree-days (HDD) is the measure of
the variation in the weather based on the extent to which the average daily temperature falls below 65° Fahrenheit, and cooling
degree-days (CDD) is the measure of the variation in the weather based on the extent to which the average daily temperature rises
above 65° Fahrenheit. Each degree of temperature above 65° Fahrenheit is counted as one cooling degree-day, and each degree of
temperature below 65° Fahrenheit is counted as one heating degree-day. In Xcel Energy’s more humid service territories, a THI is
used in place of CDD, which adds a humidity factor to CDD. HDD, CDD and THI are most likely to impact the usage of Xcel
Energy’s residential and commercial customers. Industrial customers are less weather sensitive.
Normal weather conditions are defined as either the 20-year or 30-year average of actual historical weather conditions. The
historical period of time used in the calculation of normal weather differs by jurisdiction based on the time period used by the
regulator in establishing estimated volumes in the rate setting process.
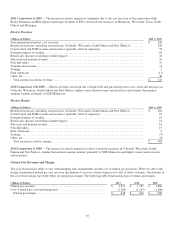
The percentage increase (decrease) in normal and actual HDD, CDD and THI are as follows:
2011 vs.
Normal 2010 vs.
Normal (a)
2011 vs.
2010 (a) 2009 vs.
Normal 2010 vs.
2009
HDD ............................................. (1.0)%
(4.3)%
3.5
% 0.4% (5.0)%
CDD ............................................. 38.1 11.9
23.4
(10.5) 23.8
THI .............................................. 37.9 29.9
6.1
(34.5) 95.1
(a) Adjusted for the October 2010 sale of SPS electric distribution assets to the city of Lubbock, Texas.
Weather — The following table summarizes the estimated impact of temperature variations on EPS compared with sales under
normal weather conditions:
2011 vs.
Normal 2010 vs.
Normal 2011 vs.
2010 2009 vs.
Normal 2010 vs.
2009
Retail electric .................................... $
0.07 $
0.04 $
0.03
$
(0.05) $
0.09
Firm natural gas .................................. 0.00 (0.01)
0.01
0.00 (0.01)
Total .......................................... $
0.07 $
0.03 $
0.04
$
(0.05) $
0.08
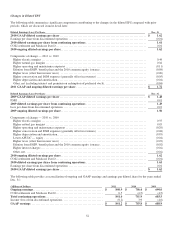
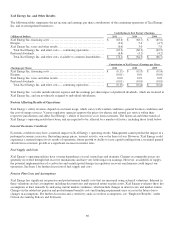
Sales Growth (Decline) — The following table summarizes Xcel Energy’s sales growth (decline) for actual and weather-
normalized sales for the years ended Dec. 31, compared with the previous year:
Dec. 31, 2011 Dec. 31, 2010
Actual
Weather
Normalized
Weather
Normalized
Lubbock (a)
Actual
Weather
Normalized
Weather
Normalized
Lubbock (a)
Electric residential ......................
0.5
% (0.5)%
0.2
% 4.6% 0.7% 0.9
%
Electric commercial and industrial .......
0.3
0.0 0.7
2.6 1.4 1.6
Total retail electric sales ..............
0.4
(0.1) 0.6
3.1 1.2 1.4
Firm natural gas sales ...................
0.9
(2.5) N/A
(2.9) (0.2) N/A
(a) Adjusted for the October 2010 sale of SPS electric distribution assets to the city of Lubbock, Texas.
During 2010, Xcel Energy experienced slightly higher than anticipated actual electric residential, commercial and industrial sales
on a weather-adjusted basis, as the economy started to improve. Sales in 2011 were lower than anticipated in the residential,
commercial and industrial segments due to weak economic recovery. Xcel Energy anticipates that sales in the future will grow at
a slower rate than historical levels, due in part to increased conservation activities. Weather-normalized sales for 2012 are
projected to grow approximately 0.5 to 1.0 percent for retail electric customers and to remain relatively flat for retail firm natural
gas customers.