Xcel Energy 2011 Annual Report Download - page 66
Download and view the complete annual report
Please find page 66 of the 2011 Xcel Energy annual report below. You can navigate through the pages in the report by either clicking on the pages listed below, or by using the keyword search tool below to find specific information within the annual report.-
 1
1 -
2
-
3
-
4
-
5
-
6
-
7
-
8
-
9
-
10
-
11
-
12
-
13
-
14
-
15
-
16
-
17
-
18
-
19
-
20
-
21
-
22
-
23
-
24
-
25
-
26
-
27
-
28
-
29
-
30
-
31
-
32
-
33
-
34
-
35
-
36
-
37
-
38
-
39
-
40
-
41
-
42
-
43
-
44
-
45
-
46
-
47
-
48
-
49
-
50
-
51
-
52
-
53
-
54
-
55
-
 56
56 -
 57
57 -
 58
58 -
 59
59 -
 60
60 -
 61
61 -
 62
62 -
 63
63 -
 64
64 -
 65
65 -
 66
66 -
 67
67 -
 68
68 -
 69
69 -
 70
70 -
 71
71 -
 72
72 -
 73
73 -
 74
74 -
 75
75 -
 76
76 -
77
-
78
-
79
-
80
-
81
-
82
-
83
-
84
-
85
-
86
-
87
-
88
-
89
-
90
-
91
-
92
-
93
-
94
-
95
-
96
-
97
-
98
-
99
-
100
-
101
-
102
-
103
-
104
-
105
-
106
-
107
-
108
-
109
-
110
-
111
-
112
-
113
-
114
-
115
-
116
-
117
-
118
-
119
-
120
-
121
-
122
-
123
-
124
-
125
-
126
-
127
-
128
-
129
-
130
-
131
-
132
-
133
-
134
-
135
-
136
-
137
-
138
-
139
-
140
-
141
-
142
-
143
-
144
-
145
-
146
-
147
-
148
-
149
-
150
-
151
-
152
-
153
-
154
-
155
-
156
-
157
-
158
-
159
-
160
-
161
-
162
-
163
-
164
-
165
 |
 |

56
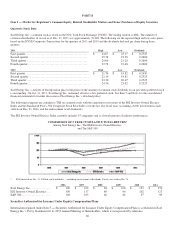
2011 Comparison to 2010 — The increase in electric margin was primarily due to the cost recovery of the acquisition of the
Rocky Mountain and Blue Spruce natural gas facilities at PSCo and retail rate increases in Minnesota, Wisconsin, Texas, North
Dakota and Michigan.
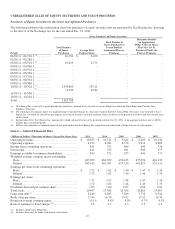
Electric Revenues
(Millions of Dollars) 2010 vs. 2009
Fuel and purchased power cost recovery ................................................................
....
$
288
Retail rate increases, including seasonal rates (Colorado, Wisconsin, South Dakota and New Mexico)
...........
228
Conservation and DSM revenue and incentive (partially offset by expenses) ................................
...
72
Estimated impact of weather................................................................
...............
65
Retail sales increase (excluding weather impact) ................................
............................
18
Sales mix and demand revenues ................................................................
...........
16
Non-fuel riders ................................................................
...........................
15
Transmission revenue................................................................
.....................
14
Trading ................................................................................................
..
2
Firm wholesale ................................................................
...........................
(11)
Other, net ................................................................
................................
40
Total increase in electric revenue ................................................................
........
$
747
2010 Comparison with 2009 — Electric revenues increased due to higher fuel and purchased power costs, retail rate increases in
Colorado, Wisconsin, South Dakota and New Mexico, higher conservation revenue and incentives and warmer than normal
summer weather, primarily at NSP-Minnesota.
Electric Margin
(Millions of Dollars) 2010 vs. 2009
Retail rate increases, including seasonal rates (Colorado, Wisconsin, South Dakota and New Mexico)
..........
$ 228
Conservation and DSM revenue and incentive (partially offset by expenses) ................................
..
72
Estimated impact of weather................................................................
..............
65
Retail sales increase (excluding weather impact) ................................
...........................
18
Sales mix and demand revenue ................................................................
...........
16
Non-fuel riders ................................................................
..........................
15
Firm wholesale ................................................................
..........................
9
Trading ................................................................................................
.
(7
)
Other, net ................................................................
...............................
(8
)
Total increase in electric margin ................................................................
........
$ 408
2010 Comparison to 2009 — The increase in electric margin was due to retail rate increases in Colorado, Wisconsin, South
Dakota and New Mexico, warmer than normal summer weather, primarily at NSP-Minnesota and higher conservation revenue
and incentives.
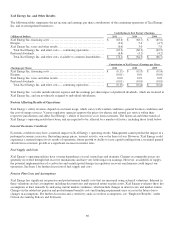
Natural Gas Revenues and Margin
The cost of natural gas tends to vary with changing sales requirements and the cost of natural gas purchases. However, due to the
design of purchased natural gas cost recovery mechanisms to recover current expenses for sales to retail customers, fluctuations in
the cost of natural gas have little effect on natural gas margin. The following table details natural gas revenues and margin:
(Millions of Dollars) 2011 2010 2009
Natural gas revenues................................
........................
$
1,812 $ 1,783 $
1,866
Cost of natural gas sold and transported ................................
......
(1,164) (1,163) (1,266)
Natural gas margin ................................
.......................
$
648 $ 620 $
600