Xcel Energy 2011 Annual Report Download - page 158
Download and view the complete annual report
Please find page 158 of the 2011 Xcel Energy annual report below. You can navigate through the pages in the report by either clicking on the pages listed below, or by using the keyword search tool below to find specific information within the annual report.-
 1
1 -
2
-
3
-
4
-
5
-
6
-
7
-
8
-
9
-
10
-
11
-
12
-
13
-
14
-
15
-
16
-
17
-
18
-
19
-
20
-
21
-
22
-
23
-
24
-
25
-
26
-
27
-
28
-
29
-
30
-
31
-
32
-
33
-
34
-
35
-
36
-
37
-
38
-
39
-
40
-
41
-
42
-
43
-
44
-
45
-
46
-
47
-
48
-
49
-
50
-
51
-
52
-
53
-
54
-
55
-
56
-
57
-
58
-
59
-
60
-
61
-
62
-
63
-
64
-
65
-
66
-
67
-
68
-
69
-
70
-
71
-
72
-
73
-
74
-
75
-
76
-
77
-
78
-
79
-
80
-
81
-
82
-
83
-
84
-
85
-
86
-
87
-
88
-
89
-
90
-
91
-
92
-
93
-
94
-
95
-
96
-
97
-
98
-
99
-
100
-
101
-
102
-
103
-
104
-
105
-
106
-
107
-
108
-
109
-
110
-
111
-
112
-
113
-
114
-
115
-
116
-
117
-
118
-
119
-
120
-
121
-
122
-
123
-
124
-
125
-
126
-
127
-
128
-
129
-
130
-
131
-
132
-
133
-
134
-
135
-
136
-
137
-
138
-
139
-
140
-
141
-
142
-
143
-
144
-
145
-
146
-
147
-
 148
148 -
 149
149 -
 150
150 -
 151
151 -
 152
152 -
 153
153 -
 154
154 -
 155
155 -
 156
156 -
 157
157 -
 158
158 -
 159
159 -
 160
160 -
 161
161 -
 162
162 -
 163
163 -
 164
164 -
 165
165
 |
 |

148
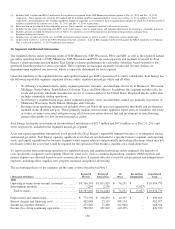
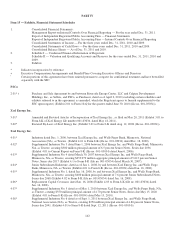
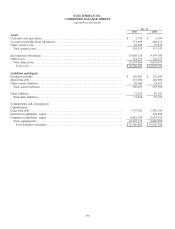
SCHEDULE I
XCEL ENERGY INC.
CONDENSED STATEMENTS OF INCOME
(amounts in thousands, except per share data)
Year Ended Dec. 31
2011 2010 2009
Income
Equity earnings of subsidiaries................................
..............
$
904,315 $
818,212 $
743,798
Total income ................................
............................
904,315 818,212 743,798
Expenses and other deductions
Operating expenses ................................
........................
14,513 11,849 9,116
Other income................................
..............................
(760) (681) (1,295)
Interest charges and financing costs ................................
.........
104,297 112,510 101,118
Total expenses and other deductions ................................
......
118,050 123,678 108,939
Income from continuing operations before income taxes
........................
786,265 694,534 634,859
Income tax benefit ................................
...........................
(55,109) (57,422) (50,665)
Income from continuing operations ................................
.........
841,374 751,956 685,524
Income (loss) from discontinued operations, net of tax
..........................
(202) 3,878 (4,637)
Net income ................................
................................
841,172 755,834 680,887
Dividend requirements on preferred stock ................................
.....
3,534 4,241 4,241
Premium on redemption of preferred stock................................
.....
3,260 - -
Earnings available to common shareholders................................
....
$
834,378 $
751,593 $
676,646
Weighted average common shares outstanding:
Basic ................................................................
.....
485,039 462,052 456,433
Diluted ................................................................
...
485,615 463,391 457,139
Earnings per average common share — basic:
Income from continuing operations ................................
.........
$
1.72 $
1.62 $
1.49
Income (loss) from discontinued operations................................
..
- 0.01 (0.01)
Earnings per share ................................
.......................
$
1.72 $
1.63 $
1.48
Earnings per average common share — diluted:
Income from continuing operations ................................
.........
$
1.72 $
1.61 $
1.49
Income (loss) from discontinued operations................................
..
- 0.01 (0.01)
Earnings per share ................................
.......................
$
1.72 $
1.62 $
1.48
Cash dividends declared per common share
................................
$
1.03 $
1.00 $
0.97