Xcel Energy 2011 Annual Report Download - page 120
Download and view the complete annual report
Please find page 120 of the 2011 Xcel Energy annual report below. You can navigate through the pages in the report by either clicking on the pages listed below, or by using the keyword search tool below to find specific information within the annual report.-
 1
1 -
2
-
3
-
4
-
5
-
6
-
7
-
8
-
9
-
10
-
11
-
12
-
13
-
14
-
15
-
16
-
17
-
18
-
19
-
20
-
21
-
22
-
23
-
24
-
25
-
26
-
27
-
28
-
29
-
30
-
31
-
32
-
33
-
34
-
35
-
36
-
37
-
38
-
39
-
40
-
41
-
42
-
43
-
44
-
45
-
46
-
47
-
48
-
49
-
50
-
51
-
52
-
53
-
54
-
55
-
56
-
57
-
58
-
59
-
60
-
61
-
62
-
63
-
64
-
65
-
66
-
67
-
68
-
69
-
70
-
71
-
72
-
73
-
74
-
75
-
76
-
77
-
78
-
79
-
80
-
81
-
82
-
83
-
84
-
85
-
86
-
87
-
88
-
89
-
90
-
91
-
92
-
93
-
94
-
95
-
96
-
97
-
98
-
99
-
100
-
101
-
102
-
103
-
104
-
105
-
106
-
107
-
108
-
109
-
 110
110 -
 111
111 -
 112
112 -
 113
113 -
 114
114 -
 115
115 -
 116
116 -
 117
117 -
 118
118 -
 119
119 -
 120
120 -
 121
121 -
 122
122 -
 123
123 -
 124
124 -
 125
125 -
 126
126 -
 127
127 -
 128
128 -
 129
129 -
 130
130 -
131
-
132
-
133
-
134
-
135
-
136
-
137
-
138
-
139
-
140
-
141
-
142
-
143
-
144
-
145
-
146
-
147
-
148
-
149
-
150
-
151
-
152
-
153
-
154
-
155
-
156
-
157
-
158
-
159
-
160
-
161
-
162
-
163
-
164
-
165
 |
 |

110
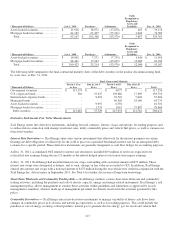
Multiemployer Plans
NSP-Minnesota and NSP-Wisconsin each contribute to several union multiemployer pension and other postretirement benefit
plans, none of which are individually significant. These plans provide pension and postretirement health care benefits to certain
union employees, including electrical workers, boilermakers, and other construction and facilities workers who may perform
services for more than one employer during a given period and do not participate in the NSP-Minnesota and NSP-Wisconsin
sponsored pension and postretirement health care plans. Contributing to these types of plans creates risk that differs from
providing benefits under NSP-Minnesota and NSP-Wisconsin sponsored plans, in that if another participating employer ceases to
contribute to a multiemployer plan, additional unfunded obligations may need to be funded over time by remaining participating
employers.
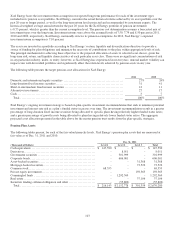
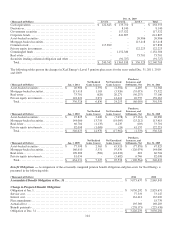
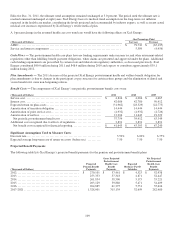
Contributions to multiemployer plans were as follows for the years ended Dec. 31, 2011, 2010 and 2009. There were no
significant changes to the nature or magnitude of the participation of NSP-Minnesota and NSP-Wisconsin in multiemployer plans
for the years presented:
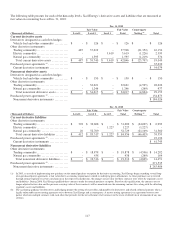
(Thousands of Dollars) 2011 2010 2009
Multiemployer pension contributions:
NSP-Minnesota ...................................................... $
17,811 $
13,461 $
11,348
NSP-Wisconsin ...................................................... 169 170 116
Total .............................................................. $
17,980 $
13,631 $
11,464
Multiemployer other postretirement benefit contributions:
NSP-Minnesota ...................................................... $
336 $
153 $
140
Total .............................................................. $
336 $
153 $
140
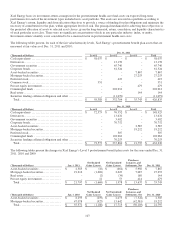
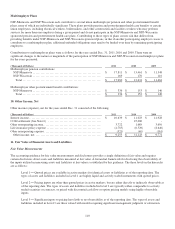
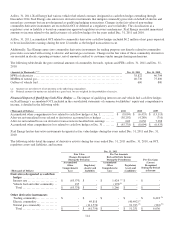
10. Other Income, Net
Other income (expense), net for the years ended Dec. 31 consisted of the following:
(Thousands of Dollars) 2011 2010 2009
Interest income ......................................................... $
10,639 $
11,023 $
14,928
COLI settlement (See Note 6) .......................................... - 25,000 -
Other nonoperating income.............................................. 3,722 1,689 3,650
Life insurance policy expense ........................................... (4,785) (6,529) (8,646)
Other nonoperating expense ............................................. (321) (40) (161)
Other income, net..................................................... $
9,255 $
31,143 $
9,771
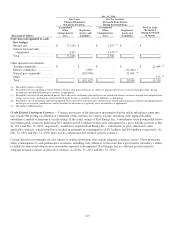
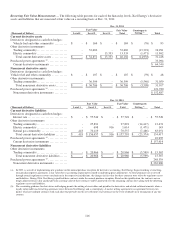
11. Fair Value of Financial Assets and Liabilities
Fair Value Measurements
The accounting guidance for fair value measurements and disclosures provides a single definition of fair value and requires
certain disclosures about assets and liabilities measured at fair value. A hierarchal framework for disclosing the observability of
the inputs utilized in measuring assets and liabilities at fair value is established by this guidance. The three levels in the hierarchy
are as follows:
Level 1 — Quoted prices are available in active markets for identical assets or liabilities as of the reporting date. The
types of assets and liabilities included in Level 1 are highly liquid and actively traded instruments with quoted prices.
Level 2 — Pricing inputs are other than quoted prices in active markets, but are either directly or indirectly observable as
of the reporting date. The types of assets and liabilities included in Level 2 are typically either comparable to actively
traded securities or contracts, or priced with discounted cash flow or option pricing models using highly observable
inputs.
Level 3 — Significant inputs to pricing have little or no observability as of the reporting date. The types of assets and
liabilities included in Level 3 are those valued with models requiring significant management judgment or estimation.