Xcel Energy 2011 Annual Report Download - page 113
Download and view the complete annual report
Please find page 113 of the 2011 Xcel Energy annual report below. You can navigate through the pages in the report by either clicking on the pages listed below, or by using the keyword search tool below to find specific information within the annual report.-
 1
1 -
2
-
3
-
4
-
5
-
6
-
7
-
8
-
9
-
10
-
11
-
12
-
13
-
14
-
15
-
16
-
17
-
18
-
19
-
20
-
21
-
22
-
23
-
24
-
25
-
26
-
27
-
28
-
29
-
30
-
31
-
32
-
33
-
34
-
35
-
36
-
37
-
38
-
39
-
40
-
41
-
42
-
43
-
44
-
45
-
46
-
47
-
48
-
49
-
50
-
51
-
52
-
53
-
54
-
55
-
56
-
57
-
58
-
59
-
60
-
61
-
62
-
63
-
64
-
65
-
66
-
67
-
68
-
69
-
70
-
71
-
72
-
73
-
74
-
75
-
76
-
77
-
78
-
79
-
80
-
81
-
82
-
83
-
84
-
85
-
86
-
87
-
88
-
89
-
90
-
91
-
92
-
93
-
94
-
95
-
96
-
97
-
98
-
99
-
100
-
101
-
102
-
 103
103 -
 104
104 -
 105
105 -
 106
106 -
 107
107 -
 108
108 -
 109
109 -
 110
110 -
 111
111 -
 112
112 -
 113
113 -
 114
114 -
 115
115 -
 116
116 -
 117
117 -
 118
118 -
 119
119 -
 120
120 -
 121
121 -
 122
122 -
 123
123 -
124
-
125
-
126
-
127
-
128
-
129
-
130
-
131
-
132
-
133
-
134
-
135
-
136
-
137
-
138
-
139
-
140
-
141
-
142
-
143
-
144
-
145
-
146
-
147
-
148
-
149
-
150
-
151
-
152
-
153
-
154
-
155
-
156
-
157
-
158
-
159
-
160
-
161
-
162
-
163
-
164
-
165
 |
 |

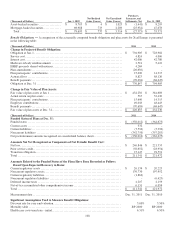
103
Xcel Energy bases the investment-return assumption on expected long-term performance for each of the investment types
included in its pension asset portfolio. Xcel Energy considers the actual historical returns achieved by its asset portfolio over the
past 20-year or longer period, as well as the long-term return levels projected and recommended by investment experts. The
historical weighted average annual return for the past 20 years for the Xcel Energy portfolio of pension investments
is 8.73 percent, which is greater than the current assumption level. The pension cost determination assumes a forecasted mix of
investment types over the long term. Investment returns were above the assumed levels of 7.50, 7.79 and 8.50 percent in 2011,
2010 and 2009, respectively. Xcel Energy continually reviews its pension assumptions. In 2012, Xcel Energy’s expected
investment return assumption is 7.10 percent.
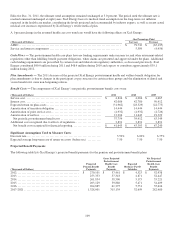
The assets are invested in a portfolio according to Xcel Energy’s return, liquidity and diversification objectives to provide a
source of funding for plan obligations and minimize the necessity of contributions to the plan, within appropriate levels of risk.
The principal mechanism for achieving these objectives is the projected allocation of assets to selected asset classes, given the
long-term risk, return, and liquidity characteristics of each particular asset class. There were no significant concentrations of risk
in any particular industry, index, or entity; however, as Xcel Energy has experienced in recent years, unusual market volatility can
impact even well-diversified portfolios and significantly affect the return levels achieved by pension assets in any year.
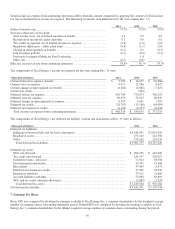
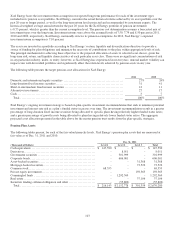
The following table presents the target pension asset allocations for Xcel Energy:
2011 2010
Domestic and international equity securities ................................
...............
27%
24
%
Long-duration fixed income securities ................................
.....................
31 41
Short-to-intermediate fixed income securities ................................
..............
12 11
Alternative investments ................................................................
..
27 17
Cash................................................................
....................
3 7
Total ................................................................
.................
100%
100
%
Xcel Energy’s ongoing investment strategy is based on plan-specific investment recommendations that seek to minimize potential
investment and interest rate risk as a plan’s funded status increases over time. The investment recommendations result in a greater
percentage of long-duration fixed income securities being allocated to specific plans having relatively higher funded status ratios,
and a greater percentage of growth assets being allocated to plans having relatively lower funded status ratios. The aggregate
projected asset allocation presented in the table above for the master pension trust results from the plan-specific strategies.
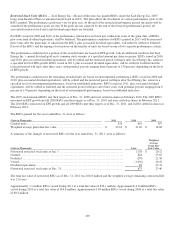
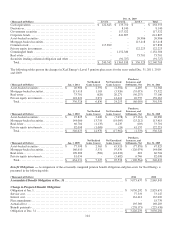
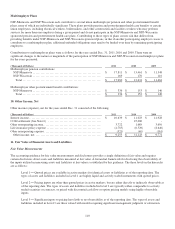
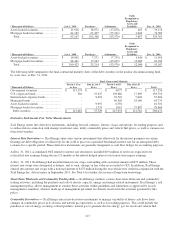
Pension Plan Assets
The following tables present, for each of the fair value hierarchy levels, Xcel Energy’s pension plan assets that are measured at
fair value as of Dec. 31, 2011 and 2010:
Dec. 31, 2011
(Thousands of Dollars) Level 1 Level 2 Level 3 Total
Cash equivalents ................................
..................
$
147,590 $
- $
- $
147,590
Derivatives................................
........................
- 8,011 - 8,011
Government securities ................................
.............
- 301,999 - 301,999
Corporate bonds................................
...................
- 606,001 - 606,001
Asset-backed securities ................................
............
- - 31,368 31,368
Mortgage-backed securities................................
.........
- - 73,522 73,522
Common stock ................................
....................
68,553 - - 68,553
Private equity investments................................
..........
- - 159,363 159,363
Commingled funds ................................
................
- 1,292,569 - 1,292,569
Real estate ................................
........................
- - 37,106 37,106
Securities lending collateral obligation and other
.....................
- (55,802) - (55,802)
Total ................................
...........................
$
216,143 $
2,152,778 $
301,359 $
2,670,280