Xcel Energy 2011 Annual Report Download - page 143
Download and view the complete annual report
Please find page 143 of the 2011 Xcel Energy annual report below. You can navigate through the pages in the report by either clicking on the pages listed below, or by using the keyword search tool below to find specific information within the annual report.-
 1
1 -
2
-
3
-
4
-
5
-
6
-
7
-
8
-
9
-
10
-
11
-
12
-
13
-
14
-
15
-
16
-
17
-
18
-
19
-
20
-
21
-
22
-
23
-
24
-
25
-
26
-
27
-
28
-
29
-
30
-
31
-
32
-
33
-
34
-
35
-
36
-
37
-
38
-
39
-
40
-
41
-
42
-
43
-
44
-
45
-
46
-
47
-
48
-
49
-
50
-
51
-
52
-
53
-
54
-
55
-
56
-
57
-
58
-
59
-
60
-
61
-
62
-
63
-
64
-
65
-
66
-
67
-
68
-
69
-
70
-
71
-
72
-
73
-
74
-
75
-
76
-
77
-
78
-
79
-
80
-
81
-
82
-
83
-
84
-
85
-
86
-
87
-
88
-
89
-
90
-
91
-
92
-
93
-
94
-
95
-
96
-
97
-
98
-
99
-
100
-
101
-
102
-
103
-
104
-
105
-
106
-
107
-
108
-
109
-
110
-
111
-
112
-
113
-
114
-
115
-
116
-
117
-
118
-
119
-
120
-
121
-
122
-
123
-
124
-
125
-
126
-
127
-
128
-
129
-
130
-
131
-
132
-
 133
133 -
 134
134 -
 135
135 -
 136
136 -
 137
137 -
 138
138 -
 139
139 -
 140
140 -
 141
141 -
 142
142 -
 143
143 -
 144
144 -
 145
145 -
 146
146 -
 147
147 -
 148
148 -
 149
149 -
 150
150 -
 151
151 -
 152
152 -
 153
153 -
154
-
155
-
156
-
157
-
158
-
159
-
160
-
161
-
162
-
163
-
164
-
165
 |
 |

133
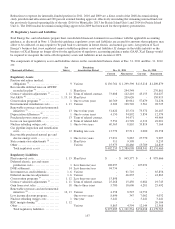
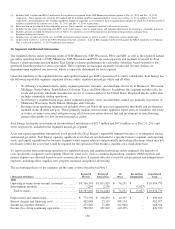
In 2011, revisions were made for nuclear, asbestos, ash-containment facilities, radiation sources and electric transmission and
distribution asset retirement obligations due to revised estimates and end of life dates.
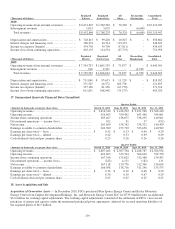
(Thousands of Dollars)
Beginning
Balance
Jan. 1, 2010
Liabilities
Recognized
Liabilities
Settled Accretion
Revisions
to Prior
Estimates
Ending
Balance
Dec. 31, 2010
Electric plant
Steam production asbestos
................
$
95,093 $
3,771
$ (2,330) $ 6,037 $ (8,942
) $ 93,629
Steam production ash containment
.........
17,552
32
- 903 1,201
19,688
Steam production radiation sources
........
176
-
- 12 (22
) 166
Nuclear production decommissioning
......
758,923
-
- 50,551 -
809,474
Wind production
.........................
7,751
25,671
- 592 4,539
38,553
Electric transmission and distribution
.......
27
-
- 12 5,688
5,727
Natural gas plant
Gas transmission and distribution
..........
936
-
- 60 -
996
Common and other property
Common general plant asbestos
............
1,021
-
- 56 -
1,077
Total liability
...........................
$
881,479 $
29,474
$ (2,330) $ 58,223 $ 2,464
$ 969,310
The fair value of NSP-Minnesota’s legally restricted assets, for purposes of settling the nuclear ARO, was $1.4 billion as of
Dec. 31, 2010, including external nuclear decommissioning investment funds and internally funded amounts.
In 2010, revisions were made for asbestos, ash-containment facilities, wind turbines, radiation sources and electric transmission
and distribution asset retirement obligations due to revised estimates and end of life dates.
Indeterminate AROs — PSCo has underground natural gas storage facilities that have special closure requirements for which the
final removal date cannot be determined; therefore, an ARO has not been recorded.
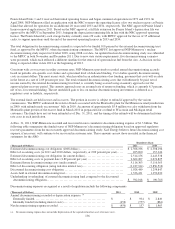
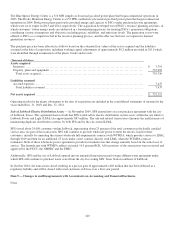
Removal Costs — Xcel Energy records a regulatory liability for the plant removal costs of other generation, transmission and
distribution facilities of its utility subsidiaries. Generally, the accrual of future non-ARO removal obligations is not required.
However, long-standing ratemaking practices approved by applicable state and federal regulatory commissions have allowed
provisions for such costs in historical depreciation rates. These removal costs have accumulated over a number of years based on
varying rates as authorized by the appropriate regulatory entities. Given the long time periods over which the amounts were
accrued and the changing of rates over time, the utility subsidiaries have estimated the amount of removal costs accumulated
through historic depreciation expense based on current factors used in the existing depreciation rates.
The accumulated balances by entity were as follows at Dec. 31:
(Millions of Dollars) 2011 2010
NSP-Minnesota .......................................................................... $
382 $
400
NSP-Wisconsin .......................................................................... 109 107
PSCo .................................................................................... 380 385
SPS ..................................................................................... 74 88
Total Xcel Energy ...................................................................... $
945 $
980
Nuclear Insurance
NSP-Minnesota’s public liability for claims resulting from any nuclear incident is limited to $12.6 billion under the Price-
Anderson amendment to the Atomic Energy Act. NSP-Minnesota has secured $375 million of coverage for its public liability
exposure with a pool of insurance companies. The remaining $12.2 billion of exposure is funded by the Secondary Financial
Protection Program, available from assessments by the federal government in case of a nuclear accident. NSP-Minnesota is
subject to assessments of up to $117.5 million per reactor per accident for each of its three licensed reactors, to be applied for
public liability arising from a nuclear incident at any licensed nuclear facility in the United States. The maximum funding
requirement is $17.5 million per reactor during any one year. These maximum assessment amounts are both subject to inflation
adjustment by the NRC and state premium taxes. The NRC’s last adjustment was effective April 2010.