Xcel Energy 2011 Annual Report Download - page 78
Download and view the complete annual report
Please find page 78 of the 2011 Xcel Energy annual report below. You can navigate through the pages in the report by either clicking on the pages listed below, or by using the keyword search tool below to find specific information within the annual report.-
 1
1 -
2
-
3
-
4
-
5
-
6
-
7
-
8
-
9
-
10
-
11
-
12
-
13
-
14
-
15
-
16
-
17
-
18
-
19
-
20
-
21
-
22
-
23
-
24
-
25
-
26
-
27
-
28
-
29
-
30
-
31
-
32
-
33
-
34
-
35
-
36
-
37
-
38
-
39
-
40
-
41
-
42
-
43
-
44
-
45
-
46
-
47
-
48
-
49
-
50
-
51
-
52
-
53
-
54
-
55
-
56
-
57
-
58
-
59
-
60
-
61
-
62
-
63
-
64
-
65
-
66
-
67
-
 68
68 -
 69
69 -
 70
70 -
 71
71 -
 72
72 -
 73
73 -
 74
74 -
 75
75 -
 76
76 -
 77
77 -
 78
78 -
 79
79 -
 80
80 -
 81
81 -
 82
82 -
 83
83 -
 84
84 -
 85
85 -
 86
86 -
 87
87 -
 88
88 -
89
-
90
-
91
-
92
-
93
-
94
-
95
-
96
-
97
-
98
-
99
-
100
-
101
-
102
-
103
-
104
-
105
-
106
-
107
-
108
-
109
-
110
-
111
-
112
-
113
-
114
-
115
-
116
-
117
-
118
-
119
-
120
-
121
-
122
-
123
-
124
-
125
-
126
-
127
-
128
-
129
-
130
-
131
-
132
-
133
-
134
-
135
-
136
-
137
-
138
-
139
-
140
-
141
-
142
-
143
-
144
-
145
-
146
-
147
-
148
-
149
-
150
-
151
-
152
-
153
-
154
-
155
-
156
-
157
-
158
-
159
-
160
-
161
-
162
-
163
-
164
-
165
 |
 |

68
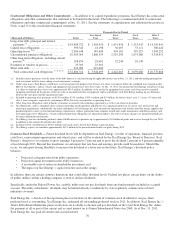
Determining the fair value of FTRs requires numerous management forecasts that vary in observability, including various forward
commodity prices, retail and wholesale demand, generation and resulting transmission system congestion. Given the limited
observability of management’s forecasts for several of these inputs, these instruments have been assigned a Level 3. Level 3
commodity derivatives assets and liabilities included $13.3 million and $0.9 million of estimated fair values, respectively, for
FTRs held at Dec. 31, 2011.
Determining the fair value of certain commodity forwards and options can require management to make use of subjective forward
price and volatility forecasts for commodities and locations with limited observability, or subjective forecasts which extend to
periods beyond those readily observable on active exchanges or quoted by brokers. When less observable forward price and
volatility forecasts are significant to determining the value of commodity forwards and options, these instruments are assigned to
Level 3. There were no Level 3 commodity forwards or options held at Dec. 31, 2011.
Nuclear Decommissioning Fund — Nuclear decommissioning fund assets assigned to Level 3 consist of asset-backed and
mortgage-backed securities, private equity investments and real estate investments. To the extent appropriate, observable market
inputs are utilized to estimate the fair value of asset-backed and mortgage-backed securities; however, less observable and
subjective inputs are often significant to these valuations, including risk-based adjustments to the interest rate used to discount
expected future cash flows, which include estimated prepayments of principal. Measurement of private equity investments and
real estate investments at net asset value requires significant use of unobservable inputs when determining the fair value of the
underlying fund investments, including equity in non-publicly traded entities and real estate properties. Therefore, estimated fair
values for asset-backed and mortgage-backed securities, private equity investments and real estate investments totaling $130.8
million in the nuclear decommissioning fund at Dec. 31, 2011 (approximately 9.4 percent of total assets measured at fair value)
are assigned to Level 3. Realized and unrealized gains and losses on nuclear decommissioning fund investments are deferred as a
regulatory asset.
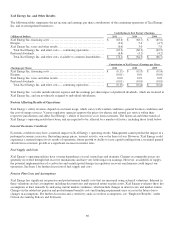
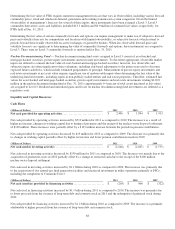
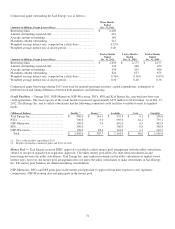
Liquidity and Capital Resources
Cash Flows
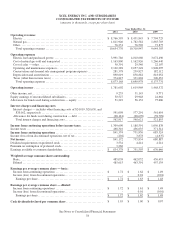
(Millions of Dollars) 2011 2010 2009
Net cash provided by operating activities
................................
$
2,406 $
1,894
$
1,913
Net cash provided by operating activities increased by $512 million for 2011 as compared to 2010. The increase was a result of
higher net income, changes in working capital due to timing of payments and the receipt of the nuclear waste disposal settlement
of $100 million. These increases were partially offset by a $103 million increase between the periods in pension contributions.
Net cash provided by operating activities decreased by $19 million for 2010 as compared to 2009. The decrease was primarily due
to changes in working capital partially offset by higher net income and lower pension contributions made in 2010.
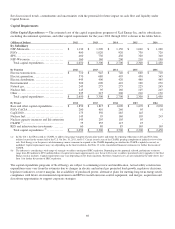
(Millions of Dollars) 2011 2010 2009
Net cash used in investing activities................................
.....
$
(2,248) $
(2,807) $
(1,735
)
Net cash used in investing activities decreased by $559 million for 2011 as compared to 2010. The decrease was mainly due to the
acquisition of generation assets in 2010 partially offset by a change in restricted cash due to the receipt of the $100 million
nuclear waste disposal settlement.
Net cash used in investing activities increased by $1.1 billion during 2010 as compared to 2009. This increase was primarily due
to the acquisition of two natural-gas fired generation facilities and increased investment in utility operations primarily at PSCo,
including the completion of Comanche Unit 3.
(Millions of Dollars) 2011 2010 2009
Net cash (used in) provided by financing activities
........................
$
(205
) $
906 $
(322)
Net cash used in financing activities increased by $1.1 billion during 2011 as compared to 2010. The increase was primarily due
to lower proceeds from the issuance of long-term debt and common stock in 2011 and the redemption of preferred stock during
2011.
Net cash provided by financing activities increased by $1.2 billion during 2010 as compared to 2009. The increase was primarily
attributable to higher proceeds from the issuance of long-term debt and common stock.