Xcel Energy 2011 Annual Report Download - page 109
Download and view the complete annual report
Please find page 109 of the 2011 Xcel Energy annual report below. You can navigate through the pages in the report by either clicking on the pages listed below, or by using the keyword search tool below to find specific information within the annual report.-
 1
1 -
2
-
3
-
4
-
5
-
6
-
7
-
8
-
9
-
10
-
11
-
12
-
13
-
14
-
15
-
16
-
17
-
18
-
19
-
20
-
21
-
22
-
23
-
24
-
25
-
26
-
27
-
28
-
29
-
30
-
31
-
32
-
33
-
34
-
35
-
36
-
37
-
38
-
39
-
40
-
41
-
42
-
43
-
44
-
45
-
46
-
47
-
48
-
49
-
50
-
51
-
52
-
53
-
54
-
55
-
56
-
57
-
58
-
59
-
60
-
61
-
62
-
63
-
64
-
65
-
66
-
67
-
68
-
69
-
70
-
71
-
72
-
73
-
74
-
75
-
76
-
77
-
78
-
79
-
80
-
81
-
82
-
83
-
84
-
85
-
86
-
87
-
88
-
89
-
90
-
91
-
92
-
93
-
94
-
95
-
96
-
97
-
98
-
 99
99 -
 100
100 -
 101
101 -
 102
102 -
 103
103 -
 104
104 -
 105
105 -
 106
106 -
 107
107 -
 108
108 -
 109
109 -
 110
110 -
 111
111 -
 112
112 -
 113
113 -
 114
114 -
 115
115 -
 116
116 -
 117
117 -
 118
118 -
 119
119 -
120
-
121
-
122
-
123
-
124
-
125
-
126
-
127
-
128
-
129
-
130
-
131
-
132
-
133
-
134
-
135
-
136
-
137
-
138
-
139
-
140
-
141
-
142
-
143
-
144
-
145
-
146
-
147
-
148
-
149
-
150
-
151
-
152
-
153
-
154
-
155
-
156
-
157
-
158
-
159
-
160
-
161
-
162
-
163
-
164
-
165
 |
 |

99
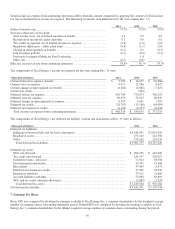
8. Share-Based Compensation
Stock Options — Xcel Energy Inc. has incentive compensation plans under which stock options and other performance incentives
are awarded to key employees. Xcel Energy Inc. has not granted stock options since December 2001.
Activity in stock options was as follows:
2011 2010 2009
(Awards in Thousands) Awards
Average
Exercise
Price Awards
Average
Exercise
Price Awards
Average
Exercise
Price
Outstanding and exercisable at Jan. 1
.....
2,498
$
30.42 6,657
$ 28.17 8,460 $
27.05
Exercised
..............................
(1,173)
25.90 (51
) 19.31 (794)
19.84
Forfeited
...............................
-
- -
- (11)
20.04
Expired
................................
(1,325)
34.42 (4,108
) 26.91 (998)
25.40
Outstanding and exercisable at Dec. 31
...
-
- 2,498
30.42 6,657
28.17
The total market value and the total intrinsic value of stock options exercised were as follows for the years ended Dec. 31:
(Thousands of Dollars) 2011 2010 2009
Market value of exercises ................................
....................
$
30,761 $
1,087 $
16,429
Intrinsic value of options exercised (a) ................................
........
380 93 670
(a) Intrinsic value is calculated as market price at exercise date less the option exercise price.
Cash received from stock options exercised and the actual tax benefit realized for the tax deductions from stock options exercised
during the years ended Dec. 31 were as follows:
(Thousands of Dollars) 2011 2010 2009
Cash received from stock options exercised ................................
....
$
30,381 $
1,033 $
15,759
Tax benefit realized for the tax deductions from stock options exercised
..........
157 40 277
Restricted Stock — Certain employees may elect to receive shares of common or restricted stock under the Xcel Energy Inc.
Executive Annual Incentive Award Plan. Restricted stock vests and settles in equal annual installments over a three-year period.
Xcel Energy Inc. reinvests dividends on the restricted stock it holds while restrictions are in place. Restrictions also apply to the
additional shares of restricted stock acquired through dividend reinvestment. If the restricted shares are forfeited, the employee is
not entitled to the dividends on those shares. Restricted stock has a fair value equal to the market trading price of Xcel Energy
Inc.’s stock at the grant date.
Xcel Energy Inc. granted shares of restricted stock for the years ended Dec. 31 as follows:
(Shares in Thousands) 2011 2010 2009
Granted shares ................................
..............................
15 44 -
Grant date fair value ................................
.........................
$
23.62 $
20.47 $
-
A summary of the changes of nonvested restricted stock for the year ended Dec. 31, 2011 were as follows:
(Shares in Thousands) Shares Weighted Average
Grant Date Fair Value
Nonvested restricted stock at Jan. 1 ................................
................
55 $ 20.28
Granted................................................................
..........
15 23.62
Vested................................................................
...........
(25) 20.53
Dividend equivalents ................................
.............................
2 24.37
Nonvested restricted stock at Dec. 31................................
...............
47 21.36