Xcel Energy 2011 Annual Report Download - page 122
Download and view the complete annual report
Please find page 122 of the 2011 Xcel Energy annual report below. You can navigate through the pages in the report by either clicking on the pages listed below, or by using the keyword search tool below to find specific information within the annual report.-
 1
1 -
2
-
3
-
4
-
5
-
6
-
7
-
8
-
9
-
10
-
11
-
12
-
13
-
14
-
15
-
16
-
17
-
18
-
19
-
20
-
21
-
22
-
23
-
24
-
25
-
26
-
27
-
28
-
29
-
30
-
31
-
32
-
33
-
34
-
35
-
36
-
37
-
38
-
39
-
40
-
41
-
42
-
43
-
44
-
45
-
46
-
47
-
48
-
49
-
50
-
51
-
52
-
53
-
54
-
55
-
56
-
57
-
58
-
59
-
60
-
61
-
62
-
63
-
64
-
65
-
66
-
67
-
68
-
69
-
70
-
71
-
72
-
73
-
74
-
75
-
76
-
77
-
78
-
79
-
80
-
81
-
82
-
83
-
84
-
85
-
86
-
87
-
88
-
89
-
90
-
91
-
92
-
93
-
94
-
95
-
96
-
97
-
98
-
99
-
100
-
101
-
102
-
103
-
104
-
105
-
106
-
107
-
108
-
109
-
110
-
111
-
 112
112 -
 113
113 -
 114
114 -
 115
115 -
 116
116 -
 117
117 -
 118
118 -
 119
119 -
 120
120 -
 121
121 -
 122
122 -
 123
123 -
 124
124 -
 125
125 -
 126
126 -
 127
127 -
 128
128 -
 129
129 -
 130
130 -
 131
131 -
 132
132 -
133
-
134
-
135
-
136
-
137
-
138
-
139
-
140
-
141
-
142
-
143
-
144
-
145
-
146
-
147
-
148
-
149
-
150
-
151
-
152
-
153
-
154
-
155
-
156
-
157
-
158
-
159
-
160
-
161
-
162
-
163
-
164
-
165
 |
 |

112
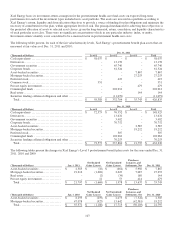
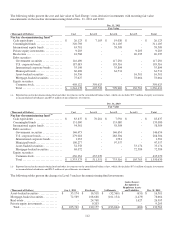
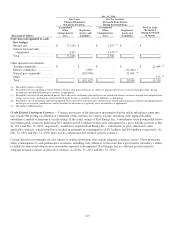
The following tables present the cost and fair value of Xcel Energy’s non-derivative instruments with recurring fair value
measurements in the nuclear decommissioning fund at Dec. 31, 2011 and 2010:
Dec. 31, 2011
Fair Value
(Thousands of Dollars) Cost Level 1 Level 2 Level 3 Total
Nuclear decommissioning fund (a)
Cash equivalents
......................
$
26,123 $
7,103 $
19,020 $
- $
26,123
Commingled funds
....................
320,798 - 311,105 - 311,105
International equity funds
..............
63,781 - 58,508 - 58,508
Private equity investments
..............
9,203 - - 9,203 9,203
Real estate
............................
24,768 - - 26,395 26,395
Debt securities:
Government securities
...............
116,490 - 117,256 - 117,256
U.S. corporate bonds
.................
187,083 - 193,516 - 193,516
International corporate bonds
.........
35,198 - 35,804 - 35,804
Municipal bonds
.....................
60,469 - 64,731 - 64,731
Asset-backed securities
..............
16,516 - - 16,501 16,501
Mortgage-backed securities
...........
75,627 - - 78,664 78,664
Equity securities:
Common stock
......................
408,122 398,625 - - 398,625
Total
...............................
$
1,344,178 $
405,728 $
799,940 $
130,763 $
1,336,431
(a) Reported in nuclear decommissioning fund and other investments on the consolidated balance sheet, which also includes $92.7 million of equity investments
in unconsolidated subsidiaries and $34.3 million of miscellaneous investments.
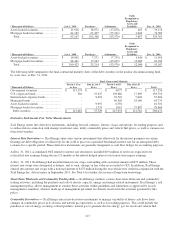
Dec. 31, 2010
Fair Value
(Thousands of Dollars) Cost Level 1 Level 2 Level 3 Total
Nuclear decommissioning fund (a)
Cash equivalents
......................
$
83,837 $
76,281 $
7,556 $
-
$
83,837
Commingled funds
....................
131,000 - 133,080 -
133,080
International equity funds
..............
54,561 - 58,584 -
58,584
Debt securities:
Government securities
...............
146,473 - 146,654 -
146,654
U.S. corporate bonds
.................
279,028 - 288,304 -
288,304
International corporate bonds
.........
1,233 - 1,581 -
1,581
Municipal bonds
.....................
100,277 - 97,557 -
97,557
Asset-backed securities
..............
32,558 - - 33,174
33,174
Mortgage-backed securities
...........
68,072 - - 72,589
72,589
Equity securities:
Common stock
......................
436,334 435,270 - -
435,270
Total
...............................
$
1,333,373 $
511,551 $
733,316 $
105,763
$
1,350,630
(a) Reported in nuclear decommissioning fund and other investments on the consolidated balance sheet, which also includes $97.6 million of equity investments
in unconsolidated subsidiaries and $28.2 million of miscellaneous investments.
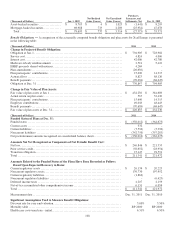
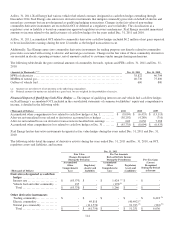
The following tables present the changes in Level 3 nuclear decommissioning fund investments:
(Thousands of Dollars) Jan. 1, 2011 Purchases Settlements
Gains (Losses)
Recognized as
Regulatory Assets
and Liabilities Dec. 31, 2011
Asset-backed securities ..............
$
33,174 $
16,518 $
(32,560) $
(631
) $
16,501
Mortgage-backed securities...........
72,589 168,688 (161,134) (1,479
) 78,664
Real estate ..........................
- 24,768 - 1,627
26,395
Private equity investments............
- 9,203 - -
9,203
Total .............................
$
105,763 $
219,177 (193,694) $
(483
) $
130,763 $