Xcel Energy 2011 Annual Report Download - page 118
Download and view the complete annual report
Please find page 118 of the 2011 Xcel Energy annual report below. You can navigate through the pages in the report by either clicking on the pages listed below, or by using the keyword search tool below to find specific information within the annual report.-
 1
1 -
2
-
3
-
4
-
5
-
6
-
7
-
8
-
9
-
10
-
11
-
12
-
13
-
14
-
15
-
16
-
17
-
18
-
19
-
20
-
21
-
22
-
23
-
24
-
25
-
26
-
27
-
28
-
29
-
30
-
31
-
32
-
33
-
34
-
35
-
36
-
37
-
38
-
39
-
40
-
41
-
42
-
43
-
44
-
45
-
46
-
47
-
48
-
49
-
50
-
51
-
52
-
53
-
54
-
55
-
56
-
57
-
58
-
59
-
60
-
61
-
62
-
63
-
64
-
65
-
66
-
67
-
68
-
69
-
70
-
71
-
72
-
73
-
74
-
75
-
76
-
77
-
78
-
79
-
80
-
81
-
82
-
83
-
84
-
85
-
86
-
87
-
88
-
89
-
90
-
91
-
92
-
93
-
94
-
95
-
96
-
97
-
98
-
99
-
100
-
101
-
102
-
103
-
104
-
105
-
106
-
107
-
 108
108 -
 109
109 -
 110
110 -
 111
111 -
 112
112 -
 113
113 -
 114
114 -
 115
115 -
 116
116 -
 117
117 -
 118
118 -
 119
119 -
 120
120 -
 121
121 -
 122
122 -
 123
123 -
 124
124 -
 125
125 -
 126
126 -
 127
127 -
 128
128 -
129
-
130
-
131
-
132
-
133
-
134
-
135
-
136
-
137
-
138
-
139
-
140
-
141
-
142
-
143
-
144
-
145
-
146
-
147
-
148
-
149
-
150
-
151
-
152
-
153
-
154
-
155
-
156
-
157
-
158
-
159
-
160
-
161
-
162
-
163
-
164
-
165
 |
 |

108
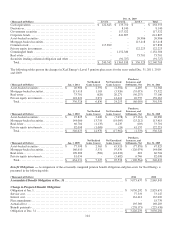
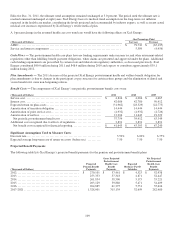
(Thousands of Dollars) Jan. 1, 2009
Net Realized
Gains (Losses)
Net Unrealized
Gains (Losses)
Purchases,
Issuances, and
Settlements, Net
Dec. 31, 2009
Asset-backed securities .................
$
8,705 $
4 $
1,025 $
(1,441) $
8,293
Mortgage-backed securities..............
69,988 733 2,289 (25,932) 47,078
Total ................................
$
78,693 $
737 $
3,314 $
(27,373) $
55,371
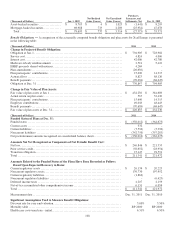
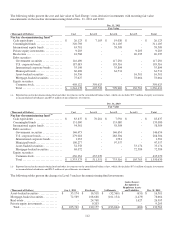
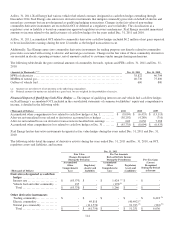
Benefit Obligations — A comparison of the actuarially computed benefit obligation and plan assets for Xcel Energy is presented
in the following table:
(Thousands of Dollars) 2011 2010
Change in Projected Benefit Obligation:
Obligation at Jan. 1 ................................................................
.....
$
794,905 $
728,902
Service cost ................................................................
............
4,824 4,006
Interest cost ................................................................
............
42,086 42,780
Medicare subsidy reimbursements ................................
.......................
3,518 5,423
ERRP proceeds shared with retirees ................................
......................
4,269 -
Plan amendments ................................................................
.......
(26,630) -
Plan participants’ contributions ................................
..........................
15,690 14,315
Actuarial loss ................................................................
..........
8,823 68,126
Benefit payments ................................................................
.......
(70,638) (68,647)
Obligation at Dec. 31 ................................................................
...
$
776,847 $
794,905
Change in Fair Value of Plan Assets:
Fair value of plan assets at Jan. 1................................
.........................
$
432,230 $
384,689
Actual return on plan assets ................................
.............................
535 53,430
Plan participants’ contributions ................................
..........................
15,690 14,315
Employer contributions ................................................................
.
49,018 48,443
Benefit payments ................................................................
.......
(70,638) (68,647)
Fair value of plan assets at Dec. 31 ................................
.......................
$
426,835 $
432,230
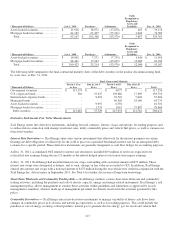
(Thousands of Dollars) 2011 2010
Funded Status of Plans at Dec. 31:
Funded status .........................................................................
$
(350,012) $
(362,675)
Current assets .........................................................................
332 -
Current liabilities ......................................................................
(7,594) (5,392)
Noncurrent liabilities ..................................................................
(342,750) (357,283)
Net postretirement amounts recognized on consolidated balance sheets.....................
$
(350,012) $
(362,675)
Amounts Not Yet Recognized as Components of Net Periodic Benefit Cost:
Net loss...............................................................................
$
246,846 $
221,335
Prior service credit.....................................................................
(50,652) (28,954)
Transition obligation...................................................................
15,147 29,591
Total .................................................................................
$
211,341 $
221,972
Amounts Related to the Funded Status of the Plans Have Been Recorded as Follows
Based Upon Expected Recovery in Rates:
Current regulatory assets ...............................................................
$
26,139 $
20,225
Noncurrent regulatory assets............................................................
176,730 197,952
Current regulatory liabilities ............................................................
(1,866) -
Noncurrent regulatory liabilities ........................................................
- (6,423)
Deferred income taxes .................................................................
4,207 4,159
Net-of-tax accumulated other comprehensive income .....................................
6,131 6,059
Total .................................................................................
$
211,341 $
221,972
Measurement date .....................................................................
Dec. 31, 2011
Dec. 31, 2010
Significant Assumptions Used to Measure Benefit Obligations:
Discount rate for year-end valuation.....................................................
5.00%
5.50%
Mortality table ........................................................................
RP 2000 RP 2000
Health care costs trend rate - initial......................................................
6.31%
6.50%