Xcel Energy 2011 Annual Report Download - page 37
Download and view the complete annual report
Please find page 37 of the 2011 Xcel Energy annual report below. You can navigate through the pages in the report by either clicking on the pages listed below, or by using the keyword search tool below to find specific information within the annual report.-
 1
1 -
2
-
3
-
4
-
5
-
6
-
7
-
8
-
9
-
10
-
11
-
12
-
13
-
14
-
15
-
16
-
17
-
18
-
19
-
20
-
21
-
22
-
23
-
24
-
25
-
26
-
 27
27 -
 28
28 -
 29
29 -
 30
30 -
 31
31 -
 32
32 -
 33
33 -
 34
34 -
 35
35 -
 36
36 -
 37
37 -
 38
38 -
 39
39 -
 40
40 -
 41
41 -
 42
42 -
 43
43 -
 44
44 -
 45
45 -
 46
46 -
 47
47 -
48
-
49
-
50
-
51
-
52
-
53
-
54
-
55
-
56
-
57
-
58
-
59
-
60
-
61
-
62
-
63
-
64
-
65
-
66
-
67
-
68
-
69
-
70
-
71
-
72
-
73
-
74
-
75
-
76
-
77
-
78
-
79
-
80
-
81
-
82
-
83
-
84
-
85
-
86
-
87
-
88
-
89
-
90
-
91
-
92
-
93
-
94
-
95
-
96
-
97
-
98
-
99
-
100
-
101
-
102
-
103
-
104
-
105
-
106
-
107
-
108
-
109
-
110
-
111
-
112
-
113
-
114
-
115
-
116
-
117
-
118
-
119
-
120
-
121
-
122
-
123
-
124
-
125
-
126
-
127
-
128
-
129
-
130
-
131
-
132
-
133
-
134
-
135
-
136
-
137
-
138
-
139
-
140
-
141
-
142
-
143
-
144
-
145
-
146
-
147
-
148
-
149
-
150
-
151
-
152
-
153
-
154
-
155
-
156
-
157
-
158
-
159
-
160
-
161
-
162
-
163
-
164
-
165
 |
 |

27
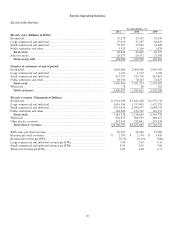
Energy Source Statistics
Year Ended Dec. 31
2011 2010 2009
Millions of
KWh Percent of
Generation
Millions of
KWh Percent of
Generation
Millions of
KWh Percent of
Generation
Coal ........................... 57,014 50% 57,832 51% 56,282
50
%
Natural Gas .................... 25,080 22 25,947 23 27,175
24
Nuclear ........................ 13,781 12 15,012 13 13,670
12
Wind (a) ........................ 11,216 10 9,885 9 9,114
8
Hydroelectric .................. 4,203 4 3,998 3 5,167
5
Other (b)........................ 1,659 2 1,663 1 1,464
1
Total ........................ 112,953 100% 114,337 100% 112,872
100
%
Owned generation .............. 74,722 66% 77,506 68% 71,474
63
%
Purchased generation ........... 38,231 34 36,831 32 41,398
37
Total ........................ 112,953 100% 114,337 100% 112,872
100
%
(a) This category includes wind energy de-bundled from RECs and also includes Windsource RECs. Xcel Energy uses RECs to meet or exceed state resource
requirements and may sell surplus RECs.
(b) Includes energy from other sources, including solar, biomass, oil and waste. Distributed generation from the Solar*Rewards program is not included.
NATURAL GAS UTILITY OPERATIONS
Overview
The most significant developments in the natural gas operations of the utility subsidiaries are continued volatility in natural gas
market prices, uncertainty regarding political and regulatory developments that impact hydraulic fracturing, safety requirements
for natural gas pipelines and the continued trend of declining use per residential and small commercial and industrial (C&I)
customer, as a result of improved building construction technologies, higher appliance efficiencies and conservation. From 2000
to 2011, average annual sales to the typical residential customer declined from 96 MMBtu per year to 80 MMBtu per year and to
the typical small C&I customer declined from 441 MMBtu per year to 377 MMBtu per year, on a weather-normalized basis.
Although wholesale price increases do not directly affect earnings because of natural gas cost-recovery mechanisms, high prices
can encourage further efficiency efforts by customers.
Recent Regulatory Development
Pipeline Safety Act — The Pipeline Safety, Regulatory Certainty, and Job Creation Act, signed into law on Jan. 3, 2012
(“Pipeline Safety Act”) requires, among other things, additional verification of pipeline infrastructure records by intrastate and
interstate pipeline owners and operators to confirm the maximum allowable operating pressure of lines located in high
consequence areas or more-densely populated areas. Where records are inadequate to confirm the maximum allowable operating
pressure, the DOT Pipeline and Hazardous Materials Safety Administration (PHMSA) will require operators to re-confirm the
maximum allowable operating pressure, a process that could cause temporary or permanent limitations on throughput for affected
pipelines. In addition, the Pipeline Safety Act requires PHMSA to issue reports and/or, if appropriate, develop new regulations,
addressing a variety of subjects, including: requiring use of automatic or remote-controlled shut-off valves in certain
circumstances; requiring testing of previously untested transmission lines located within high consequence areas operating at a
pressure greater than 30 percent of specified minimum yield stress; and expanding integrity management requirements beyond
high consequence areas. The Pipeline Safety Act also raises the maximum penalty for violating pipeline safety rules to $0.2
million per violation per day up to $2 million for a related series of violations. While Xcel Energy cannot predict the ultimate
impact Pipeline Safety Act will have on its costs, operations or financial results, Xcel Energy is taking actions that are intended to
comply with the Pipeline Safety Act and any related PHMSA regulations as they become effective.