Xcel Energy 2011 Annual Report Download - page 148
Download and view the complete annual report
Please find page 148 of the 2011 Xcel Energy annual report below. You can navigate through the pages in the report by either clicking on the pages listed below, or by using the keyword search tool below to find specific information within the annual report.-
 1
1 -
2
-
3
-
4
-
5
-
6
-
7
-
8
-
9
-
10
-
11
-
12
-
13
-
14
-
15
-
16
-
17
-
18
-
19
-
20
-
21
-
22
-
23
-
24
-
25
-
26
-
27
-
28
-
29
-
30
-
31
-
32
-
33
-
34
-
35
-
36
-
37
-
38
-
39
-
40
-
41
-
42
-
43
-
44
-
45
-
46
-
47
-
48
-
49
-
50
-
51
-
52
-
53
-
54
-
55
-
56
-
57
-
58
-
59
-
60
-
61
-
62
-
63
-
64
-
65
-
66
-
67
-
68
-
69
-
70
-
71
-
72
-
73
-
74
-
75
-
76
-
77
-
78
-
79
-
80
-
81
-
82
-
83
-
84
-
85
-
86
-
87
-
88
-
89
-
90
-
91
-
92
-
93
-
94
-
95
-
96
-
97
-
98
-
99
-
100
-
101
-
102
-
103
-
104
-
105
-
106
-
107
-
108
-
109
-
110
-
111
-
112
-
113
-
114
-
115
-
116
-
117
-
118
-
119
-
120
-
121
-
122
-
123
-
124
-
125
-
126
-
127
-
128
-
129
-
130
-
131
-
132
-
133
-
134
-
135
-
136
-
137
-
 138
138 -
 139
139 -
 140
140 -
 141
141 -
 142
142 -
 143
143 -
 144
144 -
 145
145 -
 146
146 -
 147
147 -
 148
148 -
 149
149 -
 150
150 -
 151
151 -
 152
152 -
 153
153 -
 154
154 -
 155
155 -
 156
156 -
 157
157 -
 158
158 -
159
-
160
-
161
-
162
-
163
-
164
-
165
 |
 |

138
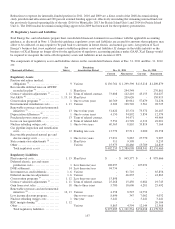
(a) Includes $365.3 million and $400.2 million for the regulatory recognition of the NSP-Minnesota pension expense at Dec. 31, 2011 and Dec. 31, 2010,
respectively. These amounts are offset by $3.9 million and $7.8 million for PSCo unamortized prior service costs at Dec. 31, 2011 and Dec. 31, 2010,
respectively. Also included are $27.2 million and $20.4 million of regulatory assets related to the non-qualified pension plan of which $12.1 million and $2.2
million is included in the current asset at Dec. 31, 2011 and Dec. 31, 2010, respectively.
(b) Earns a return on investment in the ratemaking process. These amounts are amortized consistent with recovery in rates.
(c) Includes the fair value of certain long-term PPAs used to meet energy capacity requirements and valuation adjustments on natural gas commodity purchases.
(d) Includes amounts recorded for future recovery of AROs, less amounts recovered through nuclear decommissioning accruals and gains from
decommissioning investments.
(e) Includes over- or under-recovered costs for DSM and conservation programs as well as incentives allowed in certain jurisdictions.
(f) As described in Note 12, in 2011 the CPUC determined that the customers’ share of REC margins will be netted against the RESA regulatory asset balance.
This is reflected in the Dec. 31, 2011 regulatory asset balance.
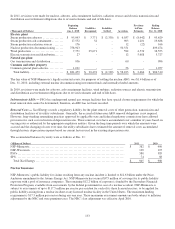
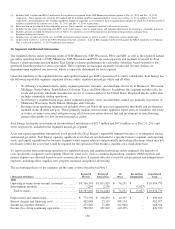
16. Segments and Related Information
The regulated electric utility operating results of NSP-Minnesota, NSP-Wisconsin, PSCo and SPS, as well as the regulated natural
gas utility operating results of NSP-Minnesota, NSP-Wisconsin and PSCo are each separately and regularly reviewed by Xcel
Energy’s chief operating decision maker. Xcel Energy evaluates performance by each utility subsidiary based on profit or loss
generated from the product or service provided. These segments are managed separately because the revenue streams are
dependent upon regulated rate recovery, which is separately determined for each segment.
Given the similarity of the regulated electric and regulated natural gas utility operations of its utility subsidiaries, Xcel Energy has
the following reportable segments: regulated electric utility, regulated natural gas utility and all other.
• Xcel Energy’s regulated electric utility segment generates, transmits, and distributes electricity in Minnesota, Wisconsin,
Michigan, North Dakota, South Dakota, Colorado, Texas, and New Mexico. In addition, this segment includes sales for
resale and provides wholesale transmission service to various entities in the United States. Regulated electric utility also
includes commodity trading operations.
• Xcel Energy’s regulated natural gas utility segment transports, stores and distributes natural gas primarily in portions of
Minnesota, Wisconsin, North Dakota, Michigan and Colorado.
• Revenues from operating segments not included above are below the necessary quantitative thresholds and are therefore
included in the all other category. Those primarily include steam revenue, appliance repair services, nonutility real estate
activities, revenues associated with processing solid waste into refuse-derived fuel and investments in rental housing
projects that qualify for low-income housing tax credits.
Xcel Energy had equity investments in unconsolidated subsidiaries of $92.7 million and $97.6 million as of Dec. 31, 2011 and
2010, respectively, included in the regulated natural gas segment.
Asset and capital expenditure information is not provided for Xcel Energy’s reportable segments because as an integrated electric
and natural gas utility, Xcel Energy operates significant assets that are not dedicated to a specific business segment, and reporting
assets and capital expenditures by business segment would require arbitrary and potentially misleading allocations which may not
necessarily reflect the assets that would be required for the operation of the business segments on a stand-alone basis.
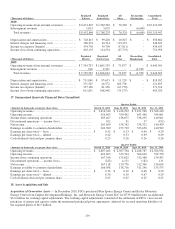
To report income from continuing operations for regulated electric and regulated natural gas utility segments, the majority of
costs are directly assigned to each segment. However, some costs, such as common depreciation, common O&M expenses and
interest expense are allocated based on cost causation allocators. A general allocator is used for certain general and administrative
expenses, including office supplies, rent, property insurance and general advertising.
The accounting policies of the segments are the same as those described in Note 1.
(Thousands of Dollars) Regulated
Electric Regulated
Natural Gas
All
Other Reconciling
Eliminations
Consolidated
Total
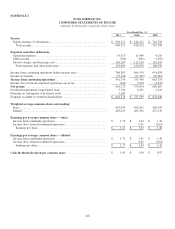
2011
Operating revenues from external customers
..........
$
8,766,593 $
1,811,926 $
76,251 $
- $
10,654,770
Intersegment revenues
..............................
1,269 2,358 - (3,627) -
Total revenues ................................
...
$
8,767,862 $
1,814,284 $
76,251 $
(3,627) $
10,654,770
Depreciation and amortization
.......................
$
773,392 $
106,870 $
10,357 $
- $
890,619
Interest charges and financing costs
..................
402,668 52,115 108,134 - 562,917
Income tax expense (benefit)
.......................
473,848 57,408 (62,940) - 468,316
Income (loss) from continuing operations
.............
788,967 101,842 (49,435) - 841,374