Xcel Energy 2011 Annual Report Download - page 112
Download and view the complete annual report
Please find page 112 of the 2011 Xcel Energy annual report below. You can navigate through the pages in the report by either clicking on the pages listed below, or by using the keyword search tool below to find specific information within the annual report.-
 1
1 -
2
-
3
-
4
-
5
-
6
-
7
-
8
-
9
-
10
-
11
-
12
-
13
-
14
-
15
-
16
-
17
-
18
-
19
-
20
-
21
-
22
-
23
-
24
-
25
-
26
-
27
-
28
-
29
-
30
-
31
-
32
-
33
-
34
-
35
-
36
-
37
-
38
-
39
-
40
-
41
-
42
-
43
-
44
-
45
-
46
-
47
-
48
-
49
-
50
-
51
-
52
-
53
-
54
-
55
-
56
-
57
-
58
-
59
-
60
-
61
-
62
-
63
-
64
-
65
-
66
-
67
-
68
-
69
-
70
-
71
-
72
-
73
-
74
-
75
-
76
-
77
-
78
-
79
-
80
-
81
-
82
-
83
-
84
-
85
-
86
-
87
-
88
-
89
-
90
-
91
-
92
-
93
-
94
-
95
-
96
-
97
-
98
-
99
-
100
-
101
-
 102
102 -
 103
103 -
 104
104 -
 105
105 -
 106
106 -
 107
107 -
 108
108 -
 109
109 -
 110
110 -
 111
111 -
 112
112 -
 113
113 -
 114
114 -
 115
115 -
 116
116 -
 117
117 -
 118
118 -
 119
119 -
 120
120 -
 121
121 -
 122
122 -
123
-
124
-
125
-
126
-
127
-
128
-
129
-
130
-
131
-
132
-
133
-
134
-
135
-
136
-
137
-
138
-
139
-
140
-
141
-
142
-
143
-
144
-
145
-
146
-
147
-
148
-
149
-
150
-
151
-
152
-
153
-
154
-
155
-
156
-
157
-
158
-
159
-
160
-
161
-
162
-
163
-
164
-
165
 |
 |

102
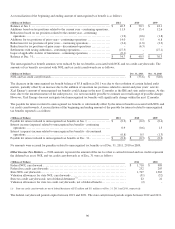
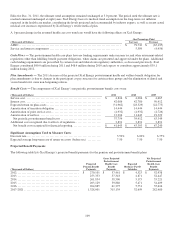
The compensation costs related to share-based awards for the years ended Dec. 31 were as follows:
(Thousands of Dollars) 2011 2010 2009
Compensation cost for share-based awards (a) (b)
............................
$
45,006 $
35,807 $
29,672
Tax benefit recognized in income ................................
.........
17,559 13,964 11,471
Total compensation cost capitalized ................................
.......
3,857 3,646 3,636
(a) Compensation costs for share-based payment arrangements is included in other O&M expense in the consolidated statements of income.
(b) Included in compensation cost for share-based awards are matching contributions related to the Xcel Energy 401(k) plan, which totaled $21.6 million, $20.7
million and $19.3 million for the years ended 2011, 2010 and 2009, respectively.
The maximum aggregate number of shares of common stock available for issuance under the Xcel Energy Inc. 2005 Long-term
Incentive Plan (as amended and restated effective Feb. 17, 2010) is 8.3 million shares. Under the Xcel Energy Inc. Executive
Annual Incentive Award Plan (as amended and restated effective Feb. 17, 2010), the total number of shares approved for issuance
is 1.2 million shares.
As of Dec. 31, 2011 and 2010, there was approximately $15.4 million and $18.6 million, respectively, of total unrecognized
compensation cost related to nonvested share-based compensation awards. Xcel Energy expects to recognize that cost over a
weighted average period of 1.9 years.
9. Benefit Plans and Other Postretirement Benefits
Xcel Energy offers various benefit plans to its employees. Approximately 50 percent of employees that receive benefits are
represented by several local labor unions under several collective-bargaining agreements. At Dec. 31, 2011:
• NSP-Minnesota had 2,033 and NSP-Wisconsin had 405 bargaining employees covered under a collective-bargaining
agreement, which expires at the end of 2013. NSP-Minnesota also had an additional 228 nuclear operation bargaining
employees covered under several collective-bargaining agreements, which expire at various dates in 2012 and 2013.
• PSCo had 2,122 bargaining employees covered under a collective-bargaining agreement, which expires in May 2014.
• SPS had 804 bargaining employees covered under a collective-bargaining agreement, which expires in October 2014.
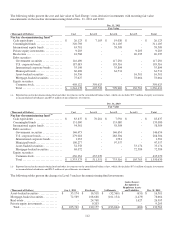
The plans invest in various instruments which are disclosed under the accounting guidance for fair value measurements which
establishes a hierarchal framework for disclosing the observability of the inputs utilized in measuring fair value. The three levels
in the hierarchy and examples of each level are as follows:
Level 1 — Quoted prices are available in active markets for identical assets as of the reporting date. The types of assets
included in Level 1 are highly liquid and actively traded instruments with quoted prices, such as common stocks listed
by the New York Stock Exchange.
Level 2 — Pricing inputs are other than quoted prices in active markets, but are either directly or indirectly observable as
of the reporting date. The types of assets included in Level 2 are typically either comparable to actively traded securities
or contracts or priced with models using highly observable inputs, such as corporate bonds with pricing based on market
interest rate curves and recent trades of similarly rated securities.
Level 3 — Significant inputs to pricing have little or no observability as of the reporting date. The types of assets
included in Level 3 are those with inputs requiring significant management judgment or estimation, such as private
equity investments and real estate investments, for which the measurement of net asset value requires significant use of
unobservable inputs when determining the fair value of the underlying fund investments, including equity in non-
publicly traded entities and real estate properties.
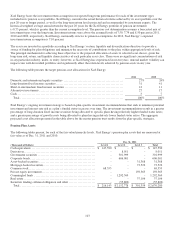
Pension Benefits
Xcel Energy has several noncontributory, defined benefit pension plans that cover almost all employees. Benefits are based on a
combination of years of service, the employee’s average pay and social security benefits. Xcel Energy’s policy is to fully fund
into an external trust the actuarially determined pension costs recognized for ratemaking and financial reporting purposes, subject
to the limitations of applicable employee benefit and tax laws.