Xcel Energy 2011 Annual Report Download - page 88
Download and view the complete annual report
Please find page 88 of the 2011 Xcel Energy annual report below. You can navigate through the pages in the report by either clicking on the pages listed below, or by using the keyword search tool below to find specific information within the annual report.-
 1
1 -
2
-
3
-
4
-
5
-
6
-
7
-
8
-
9
-
10
-
11
-
12
-
13
-
14
-
15
-
16
-
17
-
18
-
19
-
20
-
21
-
22
-
23
-
24
-
25
-
26
-
27
-
28
-
29
-
30
-
31
-
32
-
33
-
34
-
35
-
36
-
37
-
38
-
39
-
40
-
41
-
42
-
43
-
44
-
45
-
46
-
47
-
48
-
49
-
50
-
51
-
52
-
53
-
54
-
55
-
56
-
57
-
58
-
59
-
60
-
61
-
62
-
63
-
64
-
65
-
66
-
67
-
68
-
69
-
70
-
71
-
72
-
73
-
74
-
75
-
76
-
77
-
 78
78 -
 79
79 -
 80
80 -
 81
81 -
 82
82 -
 83
83 -
 84
84 -
 85
85 -
 86
86 -
 87
87 -
 88
88 -
 89
89 -
 90
90 -
 91
91 -
 92
92 -
 93
93 -
 94
94 -
 95
95 -
 96
96 -
 97
97 -
 98
98 -
99
-
100
-
101
-
102
-
103
-
104
-
105
-
106
-
107
-
108
-
109
-
110
-
111
-
112
-
113
-
114
-
115
-
116
-
117
-
118
-
119
-
120
-
121
-
122
-
123
-
124
-
125
-
126
-
127
-
128
-
129
-
130
-
131
-
132
-
133
-
134
-
135
-
136
-
137
-
138
-
139
-
140
-
141
-
142
-
143
-
144
-
145
-
146
-
147
-
148
-
149
-
150
-
151
-
152
-
153
-
154
-
155
-
156
-
157
-
158
-
159
-
160
-
161
-
162
-
163
-
164
-
165
 |
 |

78
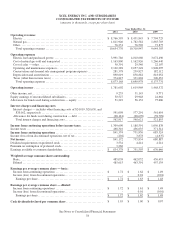
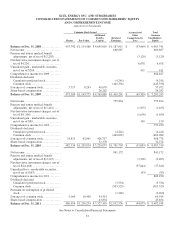
XCEL ENERGY INC. AND SUBSIDIARIES
CONSOLIDATED STATEMENTS OF INCOME
(amounts in thousands, except per share data)
Year Ended Dec. 31
2011 2010 2009
Operating revenues
Electric ................................
...............................
$
8,766,593 $
8,451,845 $
7,704,723
Natural gas................................
............................
1,811,926 1,782,582 1,865,703
Other ................................................................
.
76,251 76,520 73,877
Total operating revenues ................................
.............
10,654,770 10,310,947 9,644,303
Operating expenses
Electric fuel and purchased power................................
.......
3,991,786 4,010,660 3,672,490
Cost of natural gas sold and transported ................................
.
1,163,890 1,162,926 1,266,440
Cost of sales — other ................................
..................
30,391 29,540 22,107
Operating and maintenance expenses ................................
....
2,140,289 2,057,249 1,908,097
Conservation and demand side management program expenses
............
281,378 239,827 182,112
Depreciation and amortization ................................
..........
890,619 858,882 818,052
Taxes (other than income taxes) ................................
........
374,815 331,894 306,433
Total operating expenses ................................
.............
8,873,168 8,690,978 8,175,731
Operating income ................................
......................
1,781,602 1,619,969 1,468,572
Other income, net................................
........................
9,255 31,143 9,771
Equity earnings of unconsolidated subsidiaries
.............................
30,527 29,948 24,664
Allowance for funds used during construction — equity
....................
51,223 56,152 75,686
Interest charges and financing costs
Interest charges — includes other financing costs of $24,019, $20,638, and
$20,162, respectively ................................
................
591,098 577,291 561,654
Allowance for funds used during construction — debt
....................
(28,181) (28,670) (39,799)
Total interest charges and financing costs
..............................
562,917 548,621 521,855
Income from continuing operations before income taxes
.................
1,309,690 1,188,591 1,056,838
Income taxes ................................
............................
468,316 436,635 371,314
Income from continuing operations ................................
.....
841,374 751,956 685,524
Income (loss) from discontinued operations, net of tax
......................
(202) 3,878 (4,637)
Net income ................................
.............................
841,172 755,834 680,887
Dividend requirements on preferred stock ................................
.
3,534 4,241 4,241
Premium on redemption of preferred stock................................
.
3,260 - -
Earnings available to common shareholders
................................
$
834,378 $
751,593 $
676,646
Weighted average common shares outstanding:
Basic ................................................................
.
485,039 462,052 456,433
Diluted ................................
...............................
485,615 463,391 457,139
Earnings per average common share — basic:
Income from continuing operations ................................
.....
$
1.72 $
1.62 $
1.49
Income (loss) from discontinued operations
..............................
- 0.01 (0.01)
Earnings per share ................................
...................
$
1.72 $
1.63 $
1.48
Earnings per average common share — diluted:
Income from continuing operations ................................
.....
$
1.72 $
1.61 $
1.49
Income (loss) from discontinued operations
..............................
- 0.01 (0.01)
Earnings per share ................................
...................
$
1.72 $
1.62 $
1.48
Cash dividends declared per common share
.............................
$
1.03 $
1.00 $
0.97
See Notes to Consolidated Financial Statements