Xcel Energy 2011 Annual Report Download - page 31
Download and view the complete annual report
Please find page 31 of the 2011 Xcel Energy annual report below. You can navigate through the pages in the report by either clicking on the pages listed below, or by using the keyword search tool below to find specific information within the annual report.-
 1
1 -
2
-
3
-
4
-
5
-
6
-
7
-
8
-
9
-
10
-
11
-
12
-
13
-
14
-
15
-
16
-
17
-
18
-
19
-
20
-
 21
21 -
 22
22 -
 23
23 -
 24
24 -
 25
25 -
 26
26 -
 27
27 -
 28
28 -
 29
29 -
 30
30 -
 31
31 -
 32
32 -
 33
33 -
 34
34 -
 35
35 -
 36
36 -
 37
37 -
 38
38 -
 39
39 -
 40
40 -
 41
41 -
42
-
43
-
44
-
45
-
46
-
47
-
48
-
49
-
50
-
51
-
52
-
53
-
54
-
55
-
56
-
57
-
58
-
59
-
60
-
61
-
62
-
63
-
64
-
65
-
66
-
67
-
68
-
69
-
70
-
71
-
72
-
73
-
74
-
75
-
76
-
77
-
78
-
79
-
80
-
81
-
82
-
83
-
84
-
85
-
86
-
87
-
88
-
89
-
90
-
91
-
92
-
93
-
94
-
95
-
96
-
97
-
98
-
99
-
100
-
101
-
102
-
103
-
104
-
105
-
106
-
107
-
108
-
109
-
110
-
111
-
112
-
113
-
114
-
115
-
116
-
117
-
118
-
119
-
120
-
121
-
122
-
123
-
124
-
125
-
126
-
127
-
128
-
129
-
130
-
131
-
132
-
133
-
134
-
135
-
136
-
137
-
138
-
139
-
140
-
141
-
142
-
143
-
144
-
145
-
146
-
147
-
148
-
149
-
150
-
151
-
152
-
153
-
154
-
155
-
156
-
157
-
158
-
159
-
160
-
161
-
162
-
163
-
164
-
165
 |
 |

21
SPS Resource Plans — SPS is required to develop and implement a renewable portfolio plan in which ten percent of its energy to
serve its New Mexico retail customers is produced by renewable resources in 2011, increasing to 15 percent in 2015. SPS
primarily fulfills its renewable portfolio requirements through the purchase of wind energy. In 2009, the NMPRC granted SPS a
variance to allow SPS to delay meeting its solar energy requirement until 2012 provided that SPS compensates for any shortfall of
the 2011 solar energy requirement during 2012 through 2014. SPS executed and received NMPRC approval for a total of 50 MW
of PV solar energy PPAs. SPS requested and was granted a variance from the NMPRC to extend the time to implement a portion
of the diversity requirements to January 2014. SPS is continuing its efforts to acquire viable biomass generation or make a biogas
purchase to meet the diversity portion of its renewable energy portfolio plan in New Mexico.
SPS solicited public participation throughout 2011 in its New Mexico 2012 Integrated Resource Planning (IRP) and anticipates
filing the IRP with the NMPRC in July 2012.
CSAPR — CSAPR addresses long range transport of particulate matter and ozone by requiring reductions in SO2 and NOx from
utilities located in the eastern half of the U.S. CSAPR is discussed further at Note 13 to the consolidated financial statements —
Environmental Contingencies. Xcel Energy is in the process of determining various scenarios to respond to the CSAPR
depending on whether the CSAPR is upheld, reversed, or modified.
If the CSAPR is upheld and unmodified, Xcel Energy believes that the CSAPR could ultimately require the installation of
additional emission controls on some of SPS’ coal-fired electric generating units. If compliance is required in a short time frame,
SPS may be required to redispatch its system to reduce coal plant operating hours, in order to decrease emissions from its
facilities prior to the installation of emission controls. The expected cost for these scenarios vary significantly and SPS has
estimated capital expenditures of approximately $470 million over the next four years for the CSAPR.
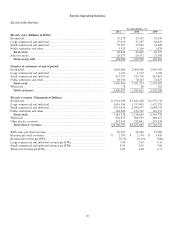
Fuel Supply and Costs
The following table shows the delivered cost per MMBtu of each significant category of fuel consumed for electric generation,
the percentage of total fuel requirements represented by each category of fuel and the total weighted average cost of all fuels.
Coal Natural Gas
SPS Generating Plants Cost Percent Cost Percent
Weighted
Average
Fuel Cost
2011
..............................
$ 1.89
67
% $ 4.37
33
% $ 2.71
2010
..............................
1.84
71
4.59
29
2.64
2009
..............................
1.74
73
3.80
27
2.3
See Items 1A and 7 for further discussion of fuel supply and costs.
Fuel Sources
Coal — SPS purchases all of the coal requirements for its two coal facilities, Harrington and Tolk electric generating stations,
from TUCO Inc. (TUCO). TUCO arranges for the purchase, receiving, transporting, unloading, handling, crushing, weighing and
delivery of coal to meet SPS’ requirements. TUCO is responsible for negotiating and administering contracts with coal suppliers,
transporters and handlers. The coal supply contract with TUCO expires in 2016 and 2017 for the Harrington station and Tolk
station, respectively. As of Dec. 31, 2011 and 2010, coal inventories at SPS were approximately 43 and 41 days supply,
respectively. TUCO has coal agreements to supply 96 percent of SPS’ coal requirements in 2012, and a declining percentage of
the requirements in subsequent years. SPS’ general coal purchasing objective is to contract for approximately 100 percent of
requirements for the following year, 67 percent of requirements in two years, and 33 percent of requirements in three years.
Natural gas — SPS uses both firm and interruptible natural gas supply and standby oil in combustion turbines and certain boilers.
Natural gas for SPS’ power plants is procured under contracts to provide an adequate supply of fuel; which typically is purchased
with terms of one year or less. The transportation and storage contracts expire in various years from 2012 to 2033. All of the
natural gas supply contracts have pricing that is tied to various natural gas indices. Most transportation contract pricing is based
on FERC and Railroad Commission of Texas approved transportation tariff rates. These transportation rates are subject to
revision based upon FERC or Railroad Commission of Texas approval of changes in the timing or amount of allowable cost
recovery by providers. Certain natural gas supply and transportation agreements include obligations for the purchase and/or
delivery of specified volumes of natural gas or to make payments in lieu of delivery. SPS’ commitments related to gas supply
contracts were approximately $24 million and $28 million and commitments related to gas transportation and storage contracts
were approximately $242 million and $233 million at Dec. 31, 2011 and Dec. 31, 2010, respectively.