Xcel Energy 2011 Annual Report Download - page 119
Download and view the complete annual report
Please find page 119 of the 2011 Xcel Energy annual report below. You can navigate through the pages in the report by either clicking on the pages listed below, or by using the keyword search tool below to find specific information within the annual report.-
 1
1 -
2
-
3
-
4
-
5
-
6
-
7
-
8
-
9
-
10
-
11
-
12
-
13
-
14
-
15
-
16
-
17
-
18
-
19
-
20
-
21
-
22
-
23
-
24
-
25
-
26
-
27
-
28
-
29
-
30
-
31
-
32
-
33
-
34
-
35
-
36
-
37
-
38
-
39
-
40
-
41
-
42
-
43
-
44
-
45
-
46
-
47
-
48
-
49
-
50
-
51
-
52
-
53
-
54
-
55
-
56
-
57
-
58
-
59
-
60
-
61
-
62
-
63
-
64
-
65
-
66
-
67
-
68
-
69
-
70
-
71
-
72
-
73
-
74
-
75
-
76
-
77
-
78
-
79
-
80
-
81
-
82
-
83
-
84
-
85
-
86
-
87
-
88
-
89
-
90
-
91
-
92
-
93
-
94
-
95
-
96
-
97
-
98
-
99
-
100
-
101
-
102
-
103
-
104
-
105
-
106
-
107
-
108
-
 109
109 -
 110
110 -
 111
111 -
 112
112 -
 113
113 -
 114
114 -
 115
115 -
 116
116 -
 117
117 -
 118
118 -
 119
119 -
 120
120 -
 121
121 -
 122
122 -
 123
123 -
 124
124 -
 125
125 -
 126
126 -
 127
127 -
 128
128 -
 129
129 -
130
-
131
-
132
-
133
-
134
-
135
-
136
-
137
-
138
-
139
-
140
-
141
-
142
-
143
-
144
-
145
-
146
-
147
-
148
-
149
-
150
-
151
-
152
-
153
-
154
-
155
-
156
-
157
-
158
-
159
-
160
-
161
-
162
-
163
-
164
-
165
 |
 |

109
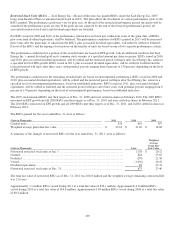
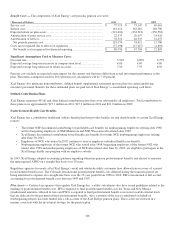
Effective Dec. 31, 2011, the ultimate trend assumption remained unchanged at 5.0 percent. The period until the ultimate rate is
reached remained unchanged at eight years. Xcel Energy bases its medical trend assumption on the long-term cost inflation
expected in the health care market, considering the levels projected and recommended by industry experts, as well as recent actual
medical cost increases experienced by Xcel Energy’s retiree medical plan.
A 1-percent change in the assumed health care cost trend rate would have the following effects on Xcel Energy:
One Percentage Point
(Thousands of Dollars) Increase Decrease
APBO ................................................................................
$
79,710 $
(65,195)
Service and interest components ........................................................
5,598 (4,456)
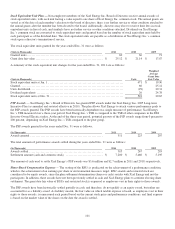
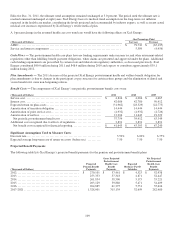
Cash Flows — The postretirement health care plans have no funding requirements under income tax and other retirement-related
regulations other than fulfilling benefit payment obligations, when claims are presented and approved under the plans. Additional
cash funding requirements are prescribed by certain state and federal rate regulatory authorities, as discussed previously. Xcel
Energy contributed $49.0 million during 2011 and $48.4 million during 2010 and expects to contribute approximately $39.1
million during 2012.
Plan Amendments — The 2011 decrease of the projected Xcel Energy postretirement health and welfare benefit obligation for
plan amendments is due to changes in the participant co-pay structure for certain retiree groups and the elimination of dental and
vision benefits for some non-bargaining retirees.
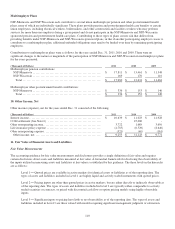
Benefit Costs — The components of Xcel Energy’s net periodic postretirement benefit costs were:
(Thousands of Dollars) 2011 2010 2009
Service cost ............................................................ $
4,824 $
4,006 $
4,665
Interest cost ............................................................ 42,086 42,780 50,412
Expected return on plan assets ........................................... (31,962) (28,529) (22,775)
Amortization of transition obligation ..................................... 14,444 14,444 14,444
Amortization of prior service cost ........................................ (4,932) (4,932) (2,726)
Amortization of net loss................................................. 13,294 11,643 19,329
Net periodic postretirement benefit cost ................................ 37,754 39,412 63,349
Additional cost recognized due to effects of regulation..................... 3,891 3,891 3,891
Net benefit cost recognized for financial reporting....................... $
41,645 $
43,303 $
67,240
Significant Assumptions Used to Measure Costs:
Discount rate ........................................................... 5.50%
6.00%
6.75%
Expected average long-term rate of return on assets (before tax) ........... 7.50 7.50 7.50
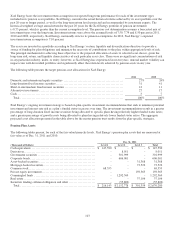
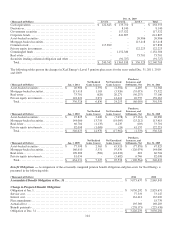
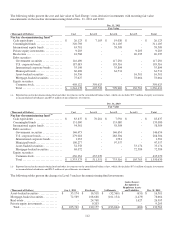
Projected Benefit Payments
The following table lists Xcel Energy’s projected benefit payments for the pension and postretirement benefit plans:
(Thousands of Dollars)
Projected
Pension Benefit
Payments
Gross Projected
Postretirement
Health Care
Benefit
Payments
Expected
Medicare Part D
Subsidies
Net Projected
Postretirement
Health Care
Benefit
Payments
2012.................................................
$
270,101 $
57,461
$
4,523 $
52,938
2013.................................................
253,333
57,318
4,871
52,447
2014.................................................
261,854
58,396
5,175
53,221
2015.................................................
263,129
59,880
5,471
54,409
2016.................................................
264,885
61,375
5,751
55,624
2017-2021 ...........................................
1,328,001
315,139
32,659
282,480