Xcel Energy 2011 Annual Report Download - page 128
Download and view the complete annual report
Please find page 128 of the 2011 Xcel Energy annual report below. You can navigate through the pages in the report by either clicking on the pages listed below, or by using the keyword search tool below to find specific information within the annual report.-
 1
1 -
2
-
3
-
4
-
5
-
6
-
7
-
8
-
9
-
10
-
11
-
12
-
13
-
14
-
15
-
16
-
17
-
18
-
19
-
20
-
21
-
22
-
23
-
24
-
25
-
26
-
27
-
28
-
29
-
30
-
31
-
32
-
33
-
34
-
35
-
36
-
37
-
38
-
39
-
40
-
41
-
42
-
43
-
44
-
45
-
46
-
47
-
48
-
49
-
50
-
51
-
52
-
53
-
54
-
55
-
56
-
57
-
58
-
59
-
60
-
61
-
62
-
63
-
64
-
65
-
66
-
67
-
68
-
69
-
70
-
71
-
72
-
73
-
74
-
75
-
76
-
77
-
78
-
79
-
80
-
81
-
82
-
83
-
84
-
85
-
86
-
87
-
88
-
89
-
90
-
91
-
92
-
93
-
94
-
95
-
96
-
97
-
98
-
99
-
100
-
101
-
102
-
103
-
104
-
105
-
106
-
107
-
108
-
109
-
110
-
111
-
112
-
113
-
114
-
115
-
116
-
117
-
 118
118 -
 119
119 -
 120
120 -
 121
121 -
 122
122 -
 123
123 -
 124
124 -
 125
125 -
 126
126 -
 127
127 -
 128
128 -
 129
129 -
 130
130 -
 131
131 -
 132
132 -
 133
133 -
 134
134 -
 135
135 -
 136
136 -
 137
137 -
 138
138 -
139
-
140
-
141
-
142
-
143
-
144
-
145
-
146
-
147
-
148
-
149
-
150
-
151
-
152
-
153
-
154
-
155
-
156
-
157
-
158
-
159
-
160
-
161
-
162
-
163
-
164
-
165
 |
 |

118
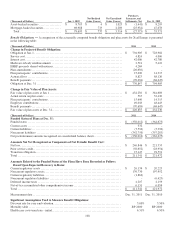
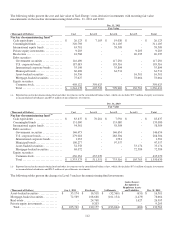
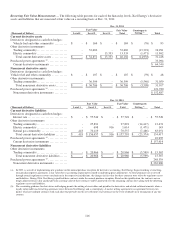
The following table presents the changes in Level 3 commodity derivatives for the years ended Dec. 31, 2011, 2010 and 2009:
Year Ended Dec. 31
(Thousands of Dollars) 2011 2010 2009
Balance at Jan. 1 ................................
...........................
$
2,392 $
28,042 $
23,221
Purchases ................................
................................
33,609 10,813 9,077
Settlements ................................
..............................
(36,555) (25,261) (18,316)
Transfers (out of) into Level 3 ................................
.............
- (13,525) 1,280
Net transactions recorded during the period:
Gains recognized in earnings (a) ................................
..........
69 6,237 8,228
Gains (losses) recognized as regulatory assets and liabilities
................
12,902 (3,914) 4,552
Balance at Dec. 31................................
..........................
$
12,417 $
2,392 $
28,042
(a) These unrealized amounts relate to commodity derivatives held at the end of the period.
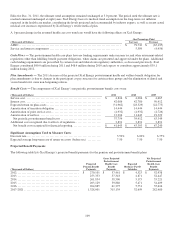
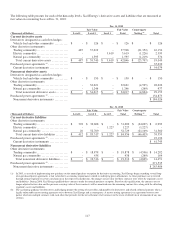
Xcel Energy recognizes transfers between levels as of the beginning of each period. There were no transfers of amounts between
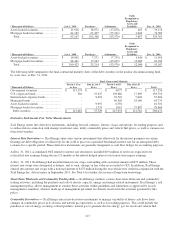
levels for the year ended Dec. 31, 2011. The following table presents the transfers that occurred from Level 3 to Level 2 during
the year ended Dec. 31, 2010.
Year Ended
(Thousands of Dollars) Dec. 31, 2010
Trading commodity derivatives not designated as cash flow hedges:
Current assets ................................................................
..........................
$
7,271
Noncurrent assets................................................................
.......................
26,438
Current liabilities ................................................................
.......................
(4,115)
Noncurrent liabilities ................................................................
...................
(16,069)
Total ................................................................
................................
$
13,525
There were no transfers of amounts from Level 2 to Level 3, or any transfers to or from Level 1 for the year ended Dec. 31, 2010.
The transfer of amounts from Level 3 to Level 2 in the year ended Dec. 31, 2010 was due to the valuation of certain long-term
derivative contracts for which observable commodity pricing forecasts became a more significant input during the period.
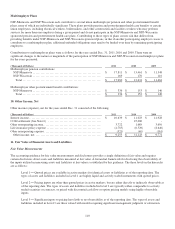
Fair Value of Long-Term Debt
As of Dec. 31, 2011 and 2010, other financial instruments for which the carrying amount did not equal fair value were as follows:
2011 2010
(Thousands of Dollars) Carrying
Amount Fair Value Carrying
Amount Fair Value
Long-term debt, including current portion
.................
$
9,908,435
$
11,734,798 $
9,318,559
$
10,224,845
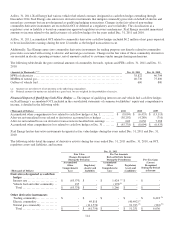
The fair value of Xcel Energy’s long-term debt is estimated based on the quoted market prices for the same or similar issues, or
the current rates for debt of the same remaining maturities and credit quality. The fair value estimates presented are based on
information available to management as of Dec. 31, 2011 and 2010. These fair value estimates have not been comprehensively
revalued for purposes of these consolidated financial statements since that date and current estimates of fair values may differ
significantly.
12. Rate Matters
NSP-Minnesota
Pending Regulatory Proceedings — MPUC
Base Rate
NSP-Minnesota - Minnesota Electric Rate Case — In November 2010, NSP-Minnesota filed a request with the MPUC to
increase electric rates in Minnesota for 2011 by approximately $150 million, or an increase of 5.62 percent and an additional
increase of $48.3 million, or 1.81 percent in 2012. The rate filing was based on a 2011 forecast test year and included a requested
ROE of 11.25 percent, an electric rate base of approximately $5.6 billion and an equity ratio of 52.56 percent. The MPUC
approved an interim rate increase of $123 million, subject to refund, effective Jan. 2, 2011.