Xcel Energy 2011 Annual Report Download - page 57
Download and view the complete annual report
Please find page 57 of the 2011 Xcel Energy annual report below. You can navigate through the pages in the report by either clicking on the pages listed below, or by using the keyword search tool below to find specific information within the annual report.-
 1
1 -
2
-
3
-
4
-
5
-
6
-
7
-
8
-
9
-
10
-
11
-
12
-
13
-
14
-
15
-
16
-
17
-
18
-
19
-
20
-
21
-
22
-
23
-
24
-
25
-
26
-
27
-
28
-
29
-
30
-
31
-
32
-
33
-
34
-
35
-
36
-
37
-
38
-
39
-
40
-
41
-
42
-
43
-
44
-
45
-
46
-
 47
47 -
 48
48 -
 49
49 -
 50
50 -
 51
51 -
 52
52 -
 53
53 -
 54
54 -
 55
55 -
 56
56 -
 57
57 -
 58
58 -
 59
59 -
 60
60 -
 61
61 -
 62
62 -
 63
63 -
 64
64 -
 65
65 -
 66
66 -
 67
67 -
68
-
69
-
70
-
71
-
72
-
73
-
74
-
75
-
76
-
77
-
78
-
79
-
80
-
81
-
82
-
83
-
84
-
85
-
86
-
87
-
88
-
89
-
90
-
91
-
92
-
93
-
94
-
95
-
96
-
97
-
98
-
99
-
100
-
101
-
102
-
103
-
104
-
105
-
106
-
107
-
108
-
109
-
110
-
111
-
112
-
113
-
114
-
115
-
116
-
117
-
118
-
119
-
120
-
121
-
122
-
123
-
124
-
125
-
126
-
127
-
128
-
129
-
130
-
131
-
132
-
133
-
134
-
135
-
136
-
137
-
138
-
139
-
140
-
141
-
142
-
143
-
144
-
145
-
146
-
147
-
148
-
149
-
150
-
151
-
152
-
153
-
154
-
155
-
156
-
157
-
158
-
159
-
160
-
161
-
162
-
163
-
164
-
165
 |
 |

47
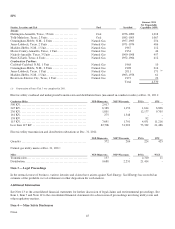
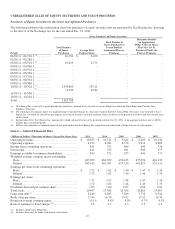
UNREGISTERED SALES OF EQUITY SECURITIES AND USE OF PROCEEDS
Purchases of Equity Securities by the Issuer and Affiliated Purchasers
The following table provides information about our purchases of equity securities that are registered by Xcel Energy Inc. pursuant
to Section 12 of the Exchange Act for the year ended Dec. 31, 2011:
Issuer Purchases of Equity Securities
Period
Total Number
of Shares
Purchased
Average Price
Paid per Share
Total Number of
Shares Purchased as
Part of Publicly
Announced Plans or
Programs
Maximum Number
(or Approximate
Dollar Value) of Shares
That May Yet Be
Purchased Under the
Plans or Programs
01/01/11 - 01/31/11 (a)
...........
16,783
$
24.00
- -
02/01/11 - 02/28/11
.............
-
-
- -
03/01/11 - 03/31/11 (b)
..........
10,625
23.75
- -
04/01/11 - 04/30/11
.............
-
-
- -
05/01/11 - 05/31/11
.............
-
-
- -
06/01/11 - 06/30/11
.............
-
-
- -
07/01/11 - 07/31/11
.............
-
-
- -
08/01/11 - 08/31/11
.............
-
-
- -
09/01/11 - 09/30/11
.............
-
-
- -
10/01/11 - 10/31/11 (c)
...........
1,049,800
103.11
- -
(d)
...........
8,500
25.84
11/01/11 - 11/30/11
.............
-
-
- -
12/01/11 - 12/31/11
.............
-
-
- -
Total
..........................
1,085,708
-
(a) Xcel Energy Inc. or one of its agents periodically purchases common shares in order to satisfy obligations under the Stock Equivalent Plan for Non-
Employee Directors.
(b) The repurchase of common shares was made pursuant to the Xcel Energy Inc. Executive Annual Incentive Award Plan. The shares were returned to Xcel
Energy Inc. on behalf of some of the participants receiving an incentive award of common shares to effectuate the payment of federal and state income taxes
on the award.
(c) In September 2011, Xcel Energy Inc. announced it would redeem all series of its preferred stock on Oct. 31, 2011, at an aggregate purchase price of $108
million, plus accrued dividends.
(d) Reflects the repurchase of common shares in the open market that Xcel Energy Inc. repurchased in connection with the exercise of stock options.
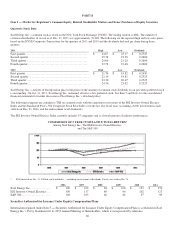
Item 6 — Selected Financial Data
(Millions of Dollars, Thousands of Shares, Except Per Share Data)
2011 2010 2009 2008 2007
Operating revenues ................................
..
$
10,655 $
10,311 $
9,644 $
11,203 $
10,034
Operating expenses ................................
..
8,873 8,691 8,176 9,812 8,683
Income from continuing operations
...................
841 752 686 646 576
Net income ................................
.........
841 756 681 646 577
Earnings available to common shareholders
............
834 752 677 641 573
Weighted average common shares outstanding:
Basic ................................
.............
485,039 462,052 456,433 437,054 416,139
Diluted ................................
...........
485,615 463,391 457,139 441,813 433,131
Earnings per share from continuing operations:
Basic ................................
.............
$
1.72 $
1.62 $
1.49 $
1.47 $
1.38
Diluted ................................
...........
1.72 1.61 1.49 1.46 1.35
Earnings per share:
Basic ................................
.............
1.72 1.63 1.48 1.47 1.38
Diluted ................................
...........
1.72 1.62 1.48 1.46 1.35
Dividends declared per common share
.................
1.03 1.00 0.97 0.94 0.91
Total assets ................................
.........
29,497 27,388 25,306 24,805 23,087
Long-term debt (a) ................................
...
8,849 9,263 7,889 7,732 6,342
Book value per share................................
.
17.44 16.76 15.92 15.35 14.70
Return on average common equity
....................
10.1%
9.8%
9.5%
9.7%
9.5
%
Ratio of earnings to fixed charges (b)
...................
2.8 2.7 2.5 2.5 2.2
(a) Includes capital lease obligations.
(b) Includes allowance for funds used during construction.