Xcel Energy 2011 Annual Report Download - page 67
Download and view the complete annual report
Please find page 67 of the 2011 Xcel Energy annual report below. You can navigate through the pages in the report by either clicking on the pages listed below, or by using the keyword search tool below to find specific information within the annual report.-
 1
1 -
2
-
3
-
4
-
5
-
6
-
7
-
8
-
9
-
10
-
11
-
12
-
13
-
14
-
15
-
16
-
17
-
18
-
19
-
20
-
21
-
22
-
23
-
24
-
25
-
26
-
27
-
28
-
29
-
30
-
31
-
32
-
33
-
34
-
35
-
36
-
37
-
38
-
39
-
40
-
41
-
42
-
43
-
44
-
45
-
46
-
47
-
48
-
49
-
50
-
51
-
52
-
53
-
54
-
55
-
56
-
 57
57 -
 58
58 -
 59
59 -
 60
60 -
 61
61 -
 62
62 -
 63
63 -
 64
64 -
 65
65 -
 66
66 -
 67
67 -
 68
68 -
 69
69 -
 70
70 -
 71
71 -
 72
72 -
 73
73 -
 74
74 -
 75
75 -
 76
76 -
 77
77 -
78
-
79
-
80
-
81
-
82
-
83
-
84
-
85
-
86
-
87
-
88
-
89
-
90
-
91
-
92
-
93
-
94
-
95
-
96
-
97
-
98
-
99
-
100
-
101
-
102
-
103
-
104
-
105
-
106
-
107
-
108
-
109
-
110
-
111
-
112
-
113
-
114
-
115
-
116
-
117
-
118
-
119
-
120
-
121
-
122
-
123
-
124
-
125
-
126
-
127
-
128
-
129
-
130
-
131
-
132
-
133
-
134
-
135
-
136
-
137
-
138
-
139
-
140
-
141
-
142
-
143
-
144
-
145
-
146
-
147
-
148
-
149
-
150
-
151
-
152
-
153
-
154
-
155
-
156
-
157
-
158
-
159
-
160
-
161
-
162
-
163
-
164
-
165
 |
 |

57
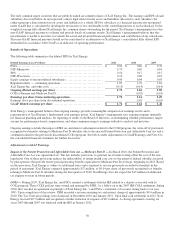
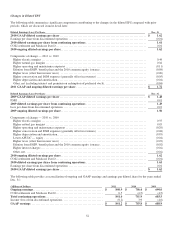
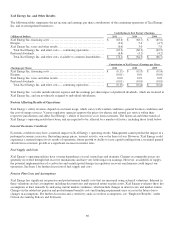
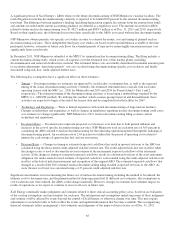
The following tables summarize the components of the changes in natural gas revenues and margin for the years ended Dec. 31:
Natural Gas Revenues
(Millions of Dollars) 2011 vs. 2010
Conservation and DSM revenue (offset by expenses) ................................
........................
$
13
Estimated impact of weather................................................................
...............
9
Return on PSCo gas in storage ................................................................
.............
4
Retail rate increase (Colorado)................................................................
.............
3
Purchased natural gas adjustment clause recovery ................................
...........................
3
Retail sales decrease (excluding weather impact) ................................
............................
(5)
Conservation and DSM incentive ................................................................
..........
(2)
Other, net ................................................................
................................
4
Total increase in natural gas revenues ................................................................
....
$
29
2011 Comparison to 2010 — Natural gas revenues increased primarily due to higher conservation and DSM rates at NSP-
Minnesota and colder weather in 2011 at PSCo and NSP-Minnesota.
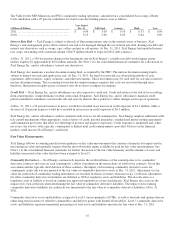
Natural Gas Margin
(Millions of Dollars) 2011 vs. 2010
Conservation and DSM revenue (offset by expenses) ................................
.......................
$
13
Estimated impact of weather................................................................
..............
9
Return on PSCo gas in storage ................................................................
............
4
Retail rate increase (Colorado)................................................................
............
3
Retail sales decrease (excluding weather impact) ................................
...........................
(5)
Conservation and DSM incentive ................................................................
.........
(2)
Other, net ................................................................
...............................
6
Total increase in natural gas margin ................................................................
.....
$
28
2011 Comparison to 2010 — Natural gas margins increased primarily due to increased due to higher conservation and DSM rates
at NSP-Minnesota and colder weather in 2011 at PSCo and NSP-Minnesota.
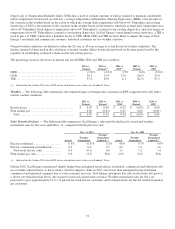
Natural Gas Revenues
(Millions of Dollars) 2010 vs. 2009
Purchased natural gas adjustment clause recovery ................................
..........................
$
(100)
Estimated impact of weather................................................................
..............
(8)
Retail sales decrease (excluding weather impact) ................................
...........................
(2)
Conservation and DSM revenue and incentive ................................
.............................
18
Rate increase (Minnesota) ................................................................
................
6
Other (including sales mix), net ................................................................
...........
3
Total decrease in natural gas revenues ................................................................
...
$
(83)
2010 Comparison to 2009 — Natural gas revenues decreased primarily due to lower natural gas costs in 2010, partially offset by
higher conservation and DSM rates.
Natural Gas Margin
(Millions of Dollars) 2010 vs. 2009
Conservation and DSM revenue and incentive (partially offset by expenses) ................................
..
$
18
Rate increase (Minnesota) ................................................................
................
6
Estimated impact of weather................................................................
..............
(8)
Retail sales decrease (excluding weather impact) ................................
...........................
(2)
Other, net ................................................................
...............................
6
Total increase in natural gas margin ................................................................
.....
$
20