Xcel Energy 2011 Annual Report Download - page 147
Download and view the complete annual report
Please find page 147 of the 2011 Xcel Energy annual report below. You can navigate through the pages in the report by either clicking on the pages listed below, or by using the keyword search tool below to find specific information within the annual report.-
 1
1 -
2
-
3
-
4
-
5
-
6
-
7
-
8
-
9
-
10
-
11
-
12
-
13
-
14
-
15
-
16
-
17
-
18
-
19
-
20
-
21
-
22
-
23
-
24
-
25
-
26
-
27
-
28
-
29
-
30
-
31
-
32
-
33
-
34
-
35
-
36
-
37
-
38
-
39
-
40
-
41
-
42
-
43
-
44
-
45
-
46
-
47
-
48
-
49
-
50
-
51
-
52
-
53
-
54
-
55
-
56
-
57
-
58
-
59
-
60
-
61
-
62
-
63
-
64
-
65
-
66
-
67
-
68
-
69
-
70
-
71
-
72
-
73
-
74
-
75
-
76
-
77
-
78
-
79
-
80
-
81
-
82
-
83
-
84
-
85
-
86
-
87
-
88
-
89
-
90
-
91
-
92
-
93
-
94
-
95
-
96
-
97
-
98
-
99
-
100
-
101
-
102
-
103
-
104
-
105
-
106
-
107
-
108
-
109
-
110
-
111
-
112
-
113
-
114
-
115
-
116
-
117
-
118
-
119
-
120
-
121
-
122
-
123
-
124
-
125
-
126
-
127
-
128
-
129
-
130
-
131
-
132
-
133
-
134
-
135
-
136
-
 137
137 -
 138
138 -
 139
139 -
 140
140 -
 141
141 -
 142
142 -
 143
143 -
 144
144 -
 145
145 -
 146
146 -
 147
147 -
 148
148 -
 149
149 -
 150
150 -
 151
151 -
 152
152 -
 153
153 -
 154
154 -
 155
155 -
 156
156 -
 157
157 -
158
-
159
-
160
-
161
-
162
-
163
-
164
-
165
 |
 |

137
Reductions to expense for internally-funded portions in 2011, 2010 and 2009 are a direct result of the 2008 decommissioning
study jurisdictional allocation and 100 percent external funding approval, effectively unwinding the remaining internal fund over
the previously licensed operating life of the unit (2010 for Monticello, 2013 for Prairie Island Unit 1 and 2014 for Prairie Island
Unit 2). The 2008 nuclear decommissioning filing approved in 2009 has been used for the regulatory presentation.
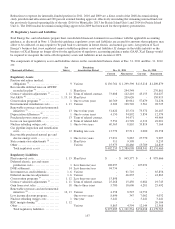
15. Regulatory Assets and Liabilities
Xcel Energy Inc. and subsidiaries prepare their consolidated financial statements in accordance with the applicable accounting
guidance, as discussed in Note 1. Under this guidance, regulatory assets and liabilities are created for amounts that regulators may
allow to be collected, or may require to be paid back to customers in future electric and natural gas rates. Any portion of Xcel
Energy’s business that is not regulated cannot establish regulatory assets and liabilities. If changes in the utility industry or the
business of Xcel Energy no longer allow for the application of regulatory accounting guidance under GAAP, Xcel Energy would
be required to recognize the write-off of regulatory assets and liabilities in net income or OCI.
The components of regulatory assets and liabilities shown on the consolidated balance sheets at Dec. 31, 2011 and Dec. 31, 2010
are:
(Thousands of Dollars)
See
Note(s)
Remaining
Amortization Period
Dec. 31, 2011
Dec. 31, 2010
Current
Noncurrent
Current
Noncurrent
Regulatory Assets
Pension and retiree medical
obligations (a)
........................
9 Various $
130,764 $
1,299,399
$
115,218
$
1,209,879
Recoverable deferred taxes on AFUDC
recorded in plant (b)
..................
1 Plant lives - 294,549
-
276,861
Contract valuation adjustments (c)
.......
1, 11 Term of related contract
73,608 142,210
45,155
134,027
Net AROs (d)
..........................
1, 13, 14 Plant lives - 209,626
-
150,913
Conservation programs (e)
..............
1 One to seven years 46,769 80,981
57,679
74,236
Environmental remediation costs
........
1, 13 Various 2,309 109,720
3,561
98,725
Renewable resources and environmental
initiatives (b)
.........................
13 One to four years 51,622 25,378
75,372
20,487
Depreciation differences (b)
.............
1 One to seven years 4,150 54,892
5,859
12,379
Purchased power contract costs
.........
13 Term of related contract
- 54,471
-
44,464
Losses on reacquired debt
..............
4 Term of related debt 5,554 43,729
6,319
49,001
Nuclear refueling outage costs
..........
1 One to two years 40,365 8,810
33,819
7,169
Gas pipeline inspection and remediation
costs
................................
12 Pending rate case 13,779 27,511
2,000
29,358
Recoverable purchased natural gas and
electric energy costs
.................
1 One to two years 17,031 9,867
27,770
9,907
State commission adjustments (b)
........
1 Plant lives 311 9,399
-
9,235
Other
................................
Various 15,973 18,466
15,789
24,819
Total regulatory assets
...............
$
402,235 $
2,389,008
$
388,541
$
2,151,460
Regulatory Liabilities
Plant removal costs
....................
1, 13 Plant lives $
- $
945,377
$
-
$
979,666
Deferred electric, gas and steam
production costs
.....................
1 Less than one year 108,057 -
107,674
-
DOE settlement
.......................
14 Less than one year 94,734 -
-
-
Investment tax credit deferrals
..........
1, 6 Various - 61,710
-
65,856
Deferred income tax adjustment
........
1, 6 Various - 46,835
-
42,863
Conservation programs (e)
..............
1, 12 Less than one year 15,898 -
-
-
Contract valuation adjustments (c)
.......
1, 11 Term of related contract
25,268 15,450
6,684
19,743
Gain from asset sales
..................
18 One to three years 5,780 18,696
4,281
25,492
Renewable resources and envi
ronmental
initiatives (b)
.........................
12, 13 Various 4,358 8,525
14,752
-
Low income discount program
..........
One to two years 8,696 347
7,062
4,032
Nuclear refueling outage costs
..........
1 One year 3,441 -
3,441
3,441
REC margin sharing (f)
.................
1, 12 - -
-
26,104
Other
................................
Various 8,863 4,594
12,144
12,568
Total regulatory liabilities
............
$
275,095 $
1,101,534
$
156,038
$
1,179,765