Xcel Energy 2011 Annual Report Download - page 63
Download and view the complete annual report
Please find page 63 of the 2011 Xcel Energy annual report below. You can navigate through the pages in the report by either clicking on the pages listed below, or by using the keyword search tool below to find specific information within the annual report.-
 1
1 -
2
-
3
-
4
-
5
-
6
-
7
-
8
-
9
-
10
-
11
-
12
-
13
-
14
-
15
-
16
-
17
-
18
-
19
-
20
-
21
-
22
-
23
-
24
-
25
-
26
-
27
-
28
-
29
-
30
-
31
-
32
-
33
-
34
-
35
-
36
-
37
-
38
-
39
-
40
-
41
-
42
-
43
-
44
-
45
-
46
-
47
-
48
-
49
-
50
-
51
-
52
-
 53
53 -
 54
54 -
 55
55 -
 56
56 -
 57
57 -
 58
58 -
 59
59 -
 60
60 -
 61
61 -
 62
62 -
 63
63 -
 64
64 -
 65
65 -
 66
66 -
 67
67 -
 68
68 -
 69
69 -
 70
70 -
 71
71 -
 72
72 -
 73
73 -
74
-
75
-
76
-
77
-
78
-
79
-
80
-
81
-
82
-
83
-
84
-
85
-
86
-
87
-
88
-
89
-
90
-
91
-
92
-
93
-
94
-
95
-
96
-
97
-
98
-
99
-
100
-
101
-
102
-
103
-
104
-
105
-
106
-
107
-
108
-
109
-
110
-
111
-
112
-
113
-
114
-
115
-
116
-
117
-
118
-
119
-
120
-
121
-
122
-
123
-
124
-
125
-
126
-
127
-
128
-
129
-
130
-
131
-
132
-
133
-
134
-
135
-
136
-
137
-
138
-
139
-
140
-
141
-
142
-
143
-
144
-
145
-
146
-
147
-
148
-
149
-
150
-
151
-
152
-
153
-
154
-
155
-
156
-
157
-
158
-
159
-
160
-
161
-
162
-
163
-
164
-
165
 |
 |

53
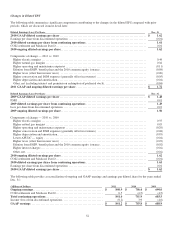
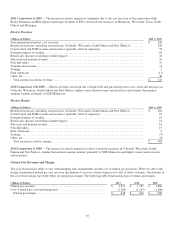
Diluted Earnings (Loss) Per Share 2011 2010 2009
Ongoing diluted earnings per share (a) ................................
...
$
1.72 $
1.62 $
1.50
COLI settlement and Medicare Part D ................................
.....
- (0.01) (0.01)
Earnings per share from continuing operations (a)
.......................
1.72 1.61 1.49
Earnings (loss) per share from discontinued operations
......................
- 0.01 (0.01)
GAAP diluted earnings per share (a) ................................
.....
$
1.72 $
1.62 $
1.48
(a) Includes the dividend requirements on preferred stock.
Continuing operations consist of the following:
• Regulated utility subsidiaries, operating in the electric and natural gas segments; and
• Other nonregulated subsidiaries and Xcel Energy Inc.
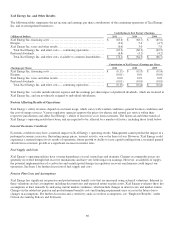
The following table summarizes the earnings contributions of Xcel Energy’s business segments on the basis of GAAP.
Contributions to Income
(Millions of Dollars) 2011 2010 2009
GAAP income (loss) by segment
Regulated electric income ................................
................
$
789.0 $
665.2 $
611.9
Regulated natural gas income................................
.............
101.8 114.6 108.9
Other income (a) ................................
.........................
17.9 32.4 27.2
Segment income — continuing operations
...............................
908.7 812.2 748.0
Xcel Energy Inc. and other costs (a) ................................
........
(67.3) (60.3) (62.5)
Total income — continuing operations ................................
..
841.4 751.9 685.5
Income (loss) from discontinued operations
................................
(0.2) 3.9 (4.6)
Total GAAP net income................................
................
$
841.2 $
755.8 $
680.9
Contributions to Diluted Earnings (Loss) Per Share
2011 2010 2009
GAAP earnings (loss) by segment ................................
.......
Regulated electric ................................
.......................
$
1.62 $
1.43 $
1.33
Regulated natural gas ................................
....................
0.21 0.24 0.24
Other (a)................................................................
.
0.04 0.08 0.06
Segment earnings per share — continuing operations
.....................
1.87 1.75 1.63
Xcel Energy Inc. and other costs (a) (b)................................
......
(0.15) (0.14) (0.14)
Total earnings per share — continuing operations (b)
......................
1.72 1.61 1.49
Earnings (loss) per share from discontinued operations
......................
- 0.01 (0.01)
Total GAAP earnings per diluted share (b)
................................
$
1.72 $
1.62 $
1.48
(a) Not a reportable segment. Included in all other segment results in Note 16 to the consolidated financial statements.
(b) Includes the dividend requirements on preferred stock.
Statement of Income Analysis
The following discussion summarizes the items that affected the individual revenue and expense items reported in the
consolidated statements of income.
Estimated Impact of Temperature Changes on Regulated Earnings — Unseasonably hot summers or cold winters increase
electric and natural gas sales while, conversely, mild weather reduces electric and natural gas sales. The estimated impact of
weather on earnings is based on the number of customers, temperature variances and the amount of natural gas or electricity the
average customer historically uses per degree of temperature. Accordingly, deviations in weather from normal levels can affect
Xcel Energy’s financial performance.