Xcel Energy 2011 Annual Report Download - page 60
Download and view the complete annual report
Please find page 60 of the 2011 Xcel Energy annual report below. You can navigate through the pages in the report by either clicking on the pages listed below, or by using the keyword search tool below to find specific information within the annual report.-
 1
1 -
2
-
3
-
4
-
5
-
6
-
7
-
8
-
9
-
10
-
11
-
12
-
13
-
14
-
15
-
16
-
17
-
18
-
19
-
20
-
21
-
22
-
23
-
24
-
25
-
26
-
27
-
28
-
29
-
30
-
31
-
32
-
33
-
34
-
35
-
36
-
37
-
38
-
39
-
40
-
41
-
42
-
43
-
44
-
45
-
46
-
47
-
48
-
49
-
 50
50 -
 51
51 -
 52
52 -
 53
53 -
 54
54 -
 55
55 -
 56
56 -
 57
57 -
 58
58 -
 59
59 -
 60
60 -
 61
61 -
 62
62 -
 63
63 -
 64
64 -
 65
65 -
 66
66 -
 67
67 -
 68
68 -
 69
69 -
 70
70 -
71
-
72
-
73
-
74
-
75
-
76
-
77
-
78
-
79
-
80
-
81
-
82
-
83
-
84
-
85
-
86
-
87
-
88
-
89
-
90
-
91
-
92
-
93
-
94
-
95
-
96
-
97
-
98
-
99
-
100
-
101
-
102
-
103
-
104
-
105
-
106
-
107
-
108
-
109
-
110
-
111
-
112
-
113
-
114
-
115
-
116
-
117
-
118
-
119
-
120
-
121
-
122
-
123
-
124
-
125
-
126
-
127
-
128
-
129
-
130
-
131
-
132
-
133
-
134
-
135
-
136
-
137
-
138
-
139
-
140
-
141
-
142
-
143
-
144
-
145
-
146
-
147
-
148
-
149
-
150
-
151
-
152
-
153
-
154
-
155
-
156
-
157
-
158
-
159
-
160
-
161
-
162
-
163
-
164
-
165
 |
 |

50
The only common equity securities that are publicly traded are common shares of Xcel Energy Inc. The earnings and EPS of each
subsidiary discussed below do not represent a direct legal interest in the assets and liabilities allocated to such subsidiary but
rather represent a direct interest in our assets and liabilities as a whole. EPS by subsidiary is a financial measure not recognized
under GAAP that is calculated by dividing the net income or loss attributable to the controlling interest of each subsidiary by the
weighted average fully diluted Xcel Energy Inc. common shares outstanding for the period. Xcel Energy’s management uses this
non-GAAP financial measure to evaluate and provide details of earnings results. Xcel Energy’s management believes that this
measurement is useful to investors to evaluate the actual and projected financial performance and contribution of our subsidiaries.
This non-GAAP financial measure should not be considered as an alternative to Xcel Energy’s consolidated fully diluted EPS
determined in accordance with GAAP as an indicator of operating performance.
Results of Operations
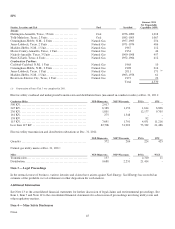
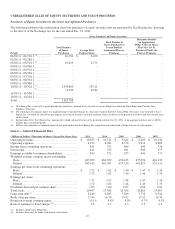
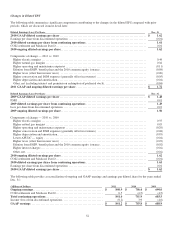
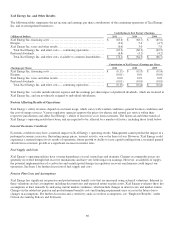
The following table summarizes the diluted EPS for Xcel Energy:
Diluted Earnings (Loss) Per Share 2011 2010 2009
PSCo ................................................................
...
$
0.82 $
0.86 $
0.72
NSP-Minnesota ................................
.........................
0.73 0.60 0.64
SPS ................................................................
....
0.18 0.17 0.15
NSP-Wisconsin ................................
.........................
0.10 0.09 0.10
Equity earnings of unconsolidated subsidiaries
.............................
0.04 0.04 0.03
Regulated utility — continuing operations ................................
.
1.87 1.76 1.64
Xcel Energy Inc. and other costs ................................
..........
(0.15) (0.14) (0.14)
Ongoing diluted earnings per share ................................
.....
1.72 1.62 1.50
COLI settlement and Medicare Part D ................................
.....
- (0.01) (0.01)
Earnings per share from continuing operations
..........................
1.72 1.61 1.49
Earnings (loss) per share from discontinued operations
......................
- 0.01 (0.01)
GAAP diluted earnings per share ................................
.......
$
1.72 $
1.62 $
1.48
Xcel Energy’s management believes that ongoing earnings provide a meaningful comparison of earnings results and is
representative of Xcel Energy’s fundamental core earnings power. Xcel Energy’s management uses ongoing earnings internally
for financial planning and analysis, for reporting of results to the Board of Directors, in determining whether performance targets
are met for performance-based compensation, and when communicating its earnings outlook to analysts and investors.
Ongoing earnings exclude the impact of IRS tax and interest adjustments related to the COLI program, the write-off of previously
recognized tax benefits relating to Medicare Part D subsidies due to the enacted Patient Protection and Affordable Care Act and a
settlement related to the previously discontinued COLI program. See below under Adjustments to GAAP Earnings and Note 6 to
the consolidated financial statements for further discussion.
Adjustments to GAAP Earnings
Impact of the Patient Protection and Affordable Care Act — Medicare Part D — In March 2010, the Patient Protection and
Affordable Care Act was signed into law. The law includes provisions to generate tax revenue to help offset the cost of the new
legislation. One of these provisions reduces the deductibility of retiree health care costs to the extent of federal subsidies received
by plan sponsors that provide retiree prescription drug benefits equivalent to Medicare Part D coverage, beginning in 2013. Based
on this provision, Xcel Energy is subject to additional taxes and is required to reverse previously recorded tax benefits in the
period of enactment. Xcel Energy expensed approximately $17 million, or $0.04 per share, of previously recognized tax benefits
relating to Medicare Part D subsidies during the first quarter of 2010. Xcel Energy does not expect the $17 million of additional
tax expense to recur in future periods.
COLI — During 2007, Xcel Energy Inc. and PSCo reached a settlement with the IRS related to a dispute associated with its
COLI program. These COLI policies were owned and managed by PSRI. As a follow on to the 2007 IRS COLI settlement, during
2010, they reached an agreement in principle of Xcel Energy Inc.’s and PSCo’s statements of account, dating back to tax year
1993. Upon completion of this review, PSRI recorded a net non-recurring tax and interest charge of approximately $9.4 million in
2010. The Tax Court proceedings were dismissed in December 2010 and January 2011. Upon final cash settlement in 2011, Xcel
Energy received $0.7 million and recognized a further reduction of expense of $0.3 million. A closing agreement covering tax
years 2003 through 2007 was finalized with the IRS in January 2012.