Xcel Energy 2011 Annual Report Download - page 114
Download and view the complete annual report
Please find page 114 of the 2011 Xcel Energy annual report below. You can navigate through the pages in the report by either clicking on the pages listed below, or by using the keyword search tool below to find specific information within the annual report.-
 1
1 -
2
-
3
-
4
-
5
-
6
-
7
-
8
-
9
-
10
-
11
-
12
-
13
-
14
-
15
-
16
-
17
-
18
-
19
-
20
-
21
-
22
-
23
-
24
-
25
-
26
-
27
-
28
-
29
-
30
-
31
-
32
-
33
-
34
-
35
-
36
-
37
-
38
-
39
-
40
-
41
-
42
-
43
-
44
-
45
-
46
-
47
-
48
-
49
-
50
-
51
-
52
-
53
-
54
-
55
-
56
-
57
-
58
-
59
-
60
-
61
-
62
-
63
-
64
-
65
-
66
-
67
-
68
-
69
-
70
-
71
-
72
-
73
-
74
-
75
-
76
-
77
-
78
-
79
-
80
-
81
-
82
-
83
-
84
-
85
-
86
-
87
-
88
-
89
-
90
-
91
-
92
-
93
-
94
-
95
-
96
-
97
-
98
-
99
-
100
-
101
-
102
-
103
-
 104
104 -
 105
105 -
 106
106 -
 107
107 -
 108
108 -
 109
109 -
 110
110 -
 111
111 -
 112
112 -
 113
113 -
 114
114 -
 115
115 -
 116
116 -
 117
117 -
 118
118 -
 119
119 -
 120
120 -
 121
121 -
 122
122 -
 123
123 -
 124
124 -
125
-
126
-
127
-
128
-
129
-
130
-
131
-
132
-
133
-
134
-
135
-
136
-
137
-
138
-
139
-
140
-
141
-
142
-
143
-
144
-
145
-
146
-
147
-
148
-
149
-
150
-
151
-
152
-
153
-
154
-
155
-
156
-
157
-
158
-
159
-
160
-
161
-
162
-
163
-
164
-
165
 |
 |

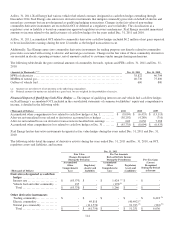
104
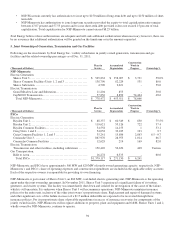
Dec. 31, 2010
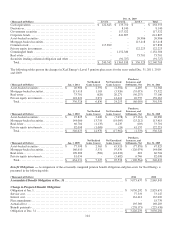
(Thousands of Dollars) Level 1 Level 2 Level 3 Total
Cash equivalents ................................
..................
$
122,643 $
135,710 $
- $
258,353
Derivatives................................
........................
- 8,140 - 8,140
Government securities ................................
.............
- 117,522 - 117,522
Corporate bonds................................
...................
- 641,807 - 641,807
Asset-backed securities ................................
............
- - 26,986 26,986
Mortgage-backed securities................................
.........
- - 113,418 113,418
Common stock ................................
....................
117,899 - - 117,899
Private equity investments................................
..........
- - 122,223 122,223
Commingled funds ................................
................
- 1,152,386 - 1,152,386
Real estate ................................
........................
- - 73,701 73,701
Securities lending collateral obligation and other
.....................
- (91,727) - (91,727)
Total ................................
...........................
$
240,542 $
1,963,838 $
336,328 $
2,540,708
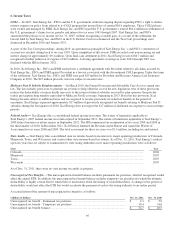
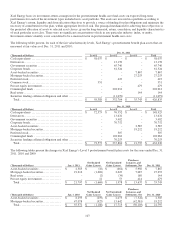
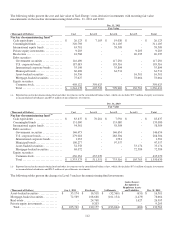
The following tables present the changes in Xcel Energy’s Level 3 pension plan assets for the years ended Dec. 31, 2011, 2010
and 2009:
(Thousands of Dollars) Jan. 1, 2011 Net Realized
Gains (Losses)
Net Unrealized
Gains (Losses)
Purchases,
Issuances, and
Settlements, Net
Dec. 31, 2011
Asset-backed securities
...................
$
26,986 $
2,391 $
(2,504) $
4,495 $
31,368
Mortgage-backed securities
................
113,418 1,103 (5,926) (35,073) 73,522
Real estate
...............................
73,701 (629) 20,271 (56,237) 37,106
Private equity investments
.................
122,223 3,971 12,412 20,757 159,363
Total ................................
..
$
336,328 $
6,836 $
24,253 $
(66,058) $
301,359
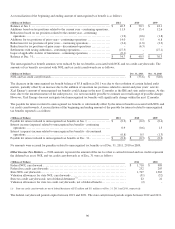
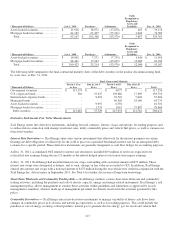
(Thousands of Dollars) Jan. 1, 2010 Net Realized
Gains (Losses)
Net Unrealized
Gains (Losses)
Purchases,
Issuances, and
Settlements, Net
Dec. 31, 2010
Asset-backed securities
...................
$
47,825 $
3,400 $
(7,078) $
(17,161) $
26,986
Mortgage-backed securities
................
144,006 13,719 (19,095) (25,212) 113,418
Real estate
...............................
66,704 (1,135) 8,235 (103) 73,701
Private equity investments
.................
82,098 (1,008) (24) 41,157 122,223
Total ................................
..
$
340,633 $
14,976 $
(17,962) $
(1,319) $
336,328
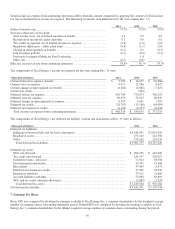
(Thousands of Dollars) Jan. 1, 2009 Net Realized
Gains (Losses)
Net Unrealized
Gains (Losses)
Purchases,
Issuances, and
Settlements, Net
Dec. 31, 2009
Asset-backed securities
...................
$
77,398 $
2,365 $
45,920 $
(77,858) $
47,825
Mortgage-backed securities
................
166,610 5,531 97,939 (126,074) 144,006
Real estate
...............................
109,289 (569) (42,638) 622 66,704
Private equity investments
.................
81,034 - (5,682) 6,746 82,098
Total ................................
..
$
434,331 $
7,327 $
95,539 $
(196,564) $
340,633
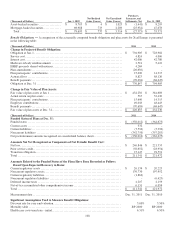
Benefit Obligations — A comparison of the actuarially computed pension benefit obligation and plan assets for Xcel Energy is
presented in the following table:
(Thousands of Dollars) 2011 2010
Accumulated Benefit Obligation at Dec. 31 ................................
..............
$
3,073,637 $
2,865,845
Change in Projected Benefit Obligation:
Obligation at Jan. 1 ................................................................
......
$
3,030,292 $
2,829,631
Service cost ................................................................
.............
77,319 73,147
Interest cost ................................................................
.............
161,412 165,010
Plan amendments ................................................................
........
- 18,739
Actuarial loss ................................................................
...........
195,369 169,203
Benefit payments ................................................................
........
(238,173) (225,438)
Obligation at Dec. 31 ................................................................
....
$
3,226,219 $
3,030,292