Xcel Energy 2011 Annual Report Download - page 161
Download and view the complete annual report
Please find page 161 of the 2011 Xcel Energy annual report below. You can navigate through the pages in the report by either clicking on the pages listed below, or by using the keyword search tool below to find specific information within the annual report.-
 1
1 -
2
-
3
-
4
-
5
-
6
-
7
-
8
-
9
-
10
-
11
-
12
-
13
-
14
-
15
-
16
-
17
-
18
-
19
-
20
-
21
-
22
-
23
-
24
-
25
-
26
-
27
-
28
-
29
-
30
-
31
-
32
-
33
-
34
-
35
-
36
-
37
-
38
-
39
-
40
-
41
-
42
-
43
-
44
-
45
-
46
-
47
-
48
-
49
-
50
-
51
-
52
-
53
-
54
-
55
-
56
-
57
-
58
-
59
-
60
-
61
-
62
-
63
-
64
-
65
-
66
-
67
-
68
-
69
-
70
-
71
-
72
-
73
-
74
-
75
-
76
-
77
-
78
-
79
-
80
-
81
-
82
-
83
-
84
-
85
-
86
-
87
-
88
-
89
-
90
-
91
-
92
-
93
-
94
-
95
-
96
-
97
-
98
-
99
-
100
-
101
-
102
-
103
-
104
-
105
-
106
-
107
-
108
-
109
-
110
-
111
-
112
-
113
-
114
-
115
-
116
-
117
-
118
-
119
-
120
-
121
-
122
-
123
-
124
-
125
-
126
-
127
-
128
-
129
-
130
-
131
-
132
-
133
-
134
-
135
-
136
-
137
-
138
-
139
-
140
-
141
-
142
-
143
-
144
-
145
-
146
-
147
-
148
-
149
-
150
-
 151
151 -
 152
152 -
 153
153 -
 154
154 -
 155
155 -
 156
156 -
 157
157 -
 158
158 -
 159
159 -
 160
160 -
 161
161 -
 162
162 -
 163
163 -
 164
164 -
 165
165
 |
 |

151
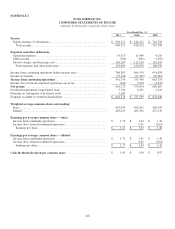
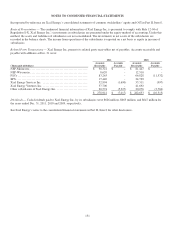
NOTES TO CONDENSED FINANCIAL STATEMENTS
Incorporated by reference are Xcel Energy’s consolidated statements of common stockholders’ equity and OCI in Part II, Item 8.
Basis of Presentation — The condensed financial information of Xcel Energy Inc. is presented to comply with Rule 12-04 of
Regulation S-X. Xcel Energy Inc.’s investments in subsidiaries are presented under the equity method of accounting. Under this
method, the assets and liabilities of subsidiaries are not consolidated. The investments in net assets of the subsidiaries are
recorded in the balance sheets. The income from operations of the subsidiaries is reported on a net basis as equity in income of
subsidiaries.
Related Party Transactions — Xcel Energy Inc. presents its related party receivables net of payables. Accounts receivable and
payable with affiliates at Dec. 31 were:
2011 2010
(Thousands of Dollars) Accounts
Receivable Accounts
Payable Accounts
Receivable Accounts
Payable
NSP-Minnesota ............................................. $
58,321 $
- $
81,447 $
-
NSP-Wisconsin ............................................. 8,620 - 12,510 -
PSCo ....................................................... 83,263 - 66,828 (11,532)
SPS ........................................................ 17,440 - 24,769 -
Xcel Energy Services Inc. ................................... 52,994 (1,690) 35,311 (997)
Xcel Energy Ventures Inc. ................................... 37,700 - 41,692 -
Other subsidiaries of Xcel Energy Inc. ........................ 20,574 (5,327) 20,076 (3,784)
$
278,912 $
(7,017) $
282,633 $
(16,313)
Dividends — Cash dividends paid to Xcel Energy Inc. by its subsidiaries were $626 million, $663 million, and $647 million for
the years ended Dec. 31, 2011, 2010 and 2009, respectively.
See Xcel Energy’s notes to the consolidated financial statements in Part II, Item 8 for other disclosures.