Xcel Energy 2011 Annual Report Download - page 126
Download and view the complete annual report
Please find page 126 of the 2011 Xcel Energy annual report below. You can navigate through the pages in the report by either clicking on the pages listed below, or by using the keyword search tool below to find specific information within the annual report.-
 1
1 -
2
-
3
-
4
-
5
-
6
-
7
-
8
-
9
-
10
-
11
-
12
-
13
-
14
-
15
-
16
-
17
-
18
-
19
-
20
-
21
-
22
-
23
-
24
-
25
-
26
-
27
-
28
-
29
-
30
-
31
-
32
-
33
-
34
-
35
-
36
-
37
-
38
-
39
-
40
-
41
-
42
-
43
-
44
-
45
-
46
-
47
-
48
-
49
-
50
-
51
-
52
-
53
-
54
-
55
-
56
-
57
-
58
-
59
-
60
-
61
-
62
-
63
-
64
-
65
-
66
-
67
-
68
-
69
-
70
-
71
-
72
-
73
-
74
-
75
-
76
-
77
-
78
-
79
-
80
-
81
-
82
-
83
-
84
-
85
-
86
-
87
-
88
-
89
-
90
-
91
-
92
-
93
-
94
-
95
-
96
-
97
-
98
-
99
-
100
-
101
-
102
-
103
-
104
-
105
-
106
-
107
-
108
-
109
-
110
-
111
-
112
-
113
-
114
-
115
-
 116
116 -
 117
117 -
 118
118 -
 119
119 -
 120
120 -
 121
121 -
 122
122 -
 123
123 -
 124
124 -
 125
125 -
 126
126 -
 127
127 -
 128
128 -
 129
129 -
 130
130 -
 131
131 -
 132
132 -
 133
133 -
 134
134 -
 135
135 -
 136
136 -
137
-
138
-
139
-
140
-
141
-
142
-
143
-
144
-
145
-
146
-
147
-
148
-
149
-
150
-
151
-
152
-
153
-
154
-
155
-
156
-
157
-
158
-
159
-
160
-
161
-
162
-
163
-
164
-
165
 |
 |

116
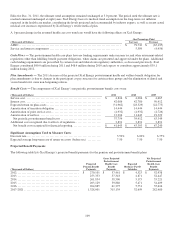
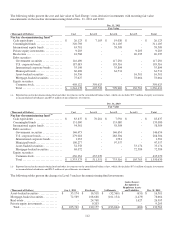
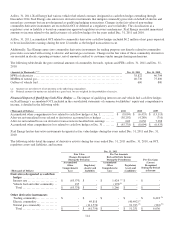
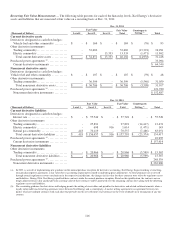
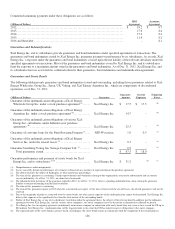
Recurring Fair Value Measurements — The following table presents for each of the hierarchy levels, Xcel Energy’s derivative
assets and liabilities that are measured at fair value on a recurring basis at Dec. 31, 2011:
Dec. 31, 2011
Fair Value
(Thousands of Dollars) Level 1 Level 2 Level 3
Fair Value
Total
Counterparty
Netting (b) Total
Current derivative assets
Derivatives designated as cash flow hedges:
Vehicle fuel and other commodity .......... $ - $
169 $
- $
169 $ (76
) $ 93
Other derivative instruments:
Trading commodity........................ - 32,682 - 32,682 (13,391
) 19,291
Electric commodity ........................ - - 13,333 13,333 (1,471
) 11,862
Total current derivative assets ............ $ - $
32,851 $
13,333 $
46,184 $ (14,938
) 31,246
Purchased power agreements (a) ...............
33,094
Current derivative instruments ..............
$ 64,340
Noncurrent derivative assets
Derivatives designated as cash flow hedges:
Vehicle fuel and other commodity ............ $ - $
107 $
- $
107 $ (59
) $ 48
Other derivative instruments:
Trading commodity........................ - 36,599 - 36,599 (5,540
) 31,059
Total noncurrent derivative assets ......... $ - $
36,706 $
- $
36,706 $ (5,599
) 31,107
Purchased power agreements (a) ...............
121,780
Noncurrent derivative instruments ..........
$ 152,887
Dec. 31, 2011
Fair Value Fair Value
Counterparty
(Thousands of Dollars) Level 1 Level 2 Level 3 Total Netting (b) Total
Current derivative liabilities
Derivatives designated as cash flow hedges:
Interest rate ...............................
$
- $
57,749 $
- $
57,749 $
- $
57,749
Other derivative instruments:
Trading commodity........................
- 27,891 - 27,891 (14,417) 13,474
Electric commodity ........................
- 698 916 1,614 (1,471) 143
Natural gas commodity ....................
418 70,119 - 70,537 (7,486) 63,051
Total current derivative liabilities .........
$
418 $
156,457 $
916 $
157,791 $
(23,374) 134,417
Purchased power agreements (a) ...............
22,997
Current derivative instruments ..............
$
157,414
Noncurrent derivative liabilities
Other derivative instruments:
Trading commodity........................
$
- $
20,966 $
- $
20,966 $
(5,599) $
15,367
Total noncurrent derivative liabilities......
$
- $
20,966 $
- $
20,966 $
(5,599) 15,367
Purchased power agreements (a) ...............
248,539
Noncurrent derivative instruments ..........
$
263,906
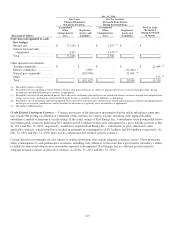
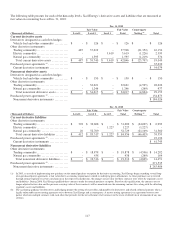
(a) In 2003, as a result of implementing new guidance on the normal purchase exception for derivative accounting, Xcel Energy began recording several long-
term purchased power agreements at fair value due to accounting requirements related to underlying price adjustments. As these purchases are recovered
through normal regulatory recovery mechanisms in the respective jurisdictions, the changes in fair value for these contracts were offset by regulatory assets
and liabilities. During 2006, Xcel Energy qualified these contracts under the normal purchase exception. Based on this qualification, the contracts are no
longer adjusted to fair value and the previous carrying value of these contracts will be amortized over the remaining contract lives along with the offsetting
regulatory assets and liabilities.
(b) The accounting guidance for derivatives and hedging permits the netting of receivables and payables for derivatives and related collateral amounts when a
legally enforceable master netting agreement exists between Xcel Energy and a counterparty. A master netting agreement is an agreement between two
parties who have multiple contracts with each other that provides for the net settlement of all contracts in the event of default on or termination of any one
contract.