Xcel Energy 2011 Annual Report Download - page 115
Download and view the complete annual report
Please find page 115 of the 2011 Xcel Energy annual report below. You can navigate through the pages in the report by either clicking on the pages listed below, or by using the keyword search tool below to find specific information within the annual report.-
 1
1 -
2
-
3
-
4
-
5
-
6
-
7
-
8
-
9
-
10
-
11
-
12
-
13
-
14
-
15
-
16
-
17
-
18
-
19
-
20
-
21
-
22
-
23
-
24
-
25
-
26
-
27
-
28
-
29
-
30
-
31
-
32
-
33
-
34
-
35
-
36
-
37
-
38
-
39
-
40
-
41
-
42
-
43
-
44
-
45
-
46
-
47
-
48
-
49
-
50
-
51
-
52
-
53
-
54
-
55
-
56
-
57
-
58
-
59
-
60
-
61
-
62
-
63
-
64
-
65
-
66
-
67
-
68
-
69
-
70
-
71
-
72
-
73
-
74
-
75
-
76
-
77
-
78
-
79
-
80
-
81
-
82
-
83
-
84
-
85
-
86
-
87
-
88
-
89
-
90
-
91
-
92
-
93
-
94
-
95
-
96
-
97
-
98
-
99
-
100
-
101
-
102
-
103
-
104
-
 105
105 -
 106
106 -
 107
107 -
 108
108 -
 109
109 -
 110
110 -
 111
111 -
 112
112 -
 113
113 -
 114
114 -
 115
115 -
 116
116 -
 117
117 -
 118
118 -
 119
119 -
 120
120 -
 121
121 -
 122
122 -
 123
123 -
 124
124 -
 125
125 -
126
-
127
-
128
-
129
-
130
-
131
-
132
-
133
-
134
-
135
-
136
-
137
-
138
-
139
-
140
-
141
-
142
-
143
-
144
-
145
-
146
-
147
-
148
-
149
-
150
-
151
-
152
-
153
-
154
-
155
-
156
-
157
-
158
-
159
-
160
-
161
-
162
-
163
-
164
-
165
 |
 |

105
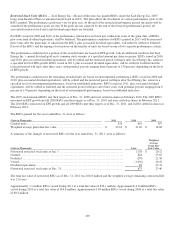
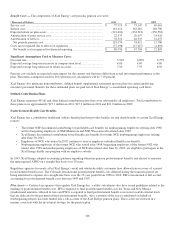
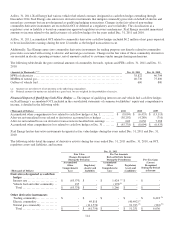
(Thousands of Dollars) 2011 2010
Change in Fair Value of Plan Assets:
Fair value of plan assets at Jan. 1................................
..........................
$
2,540,708 $
2,449,326
Actual return on plan assets ................................
..............................
230,401 282,688
Employer contributions ................................................................
..
137,344 34,132
Benefit payments ................................................................
........
(238,173) (225,438)
Fair value of plan assets at Dec. 31 ................................
........................
$
2,670,280 $
2,540,708
Funded Status of Plans at Dec. 31:
Funded status (a) ................................................................
.........
$
(555,939) $
(489,584)
Amounts Not Yet Recognized as Components of Net Periodic Benefit Cost:
Net loss................................................................
.................
$
1,610,946 $
1,502,888
Prior service cost ................................................................
........
18,432 40,965
Total ................................................................
...................
$
1,629,378 $
1,543,853
Amounts Related to the Funded Status of the Plans Have Been Recorded as Follows
Based Upon Expected Recovery in Rates:
Current regulatory assets ................................
................................
$
123,814 $
92,765
Noncurrent regulatory assets................................
..............................
1,435,372 1,386,125
Deferred income taxes ................................................................
...
28,759 26,592
Net-of-tax accumulated other comprehensive income ................................
.......
41,433 38,371
Total ................................................................
...................
$
1,629,378 $
1,543,853
Measurement date ................................................................
.......
Dec. 31, 2011
Dec. 31, 2010
Significant Assumptions Used to Measure Benefit Obligations:
Discount rate for year-end valuation................................
.......................
5.00%
5.50%
Expected average long-term increase in compensation level
................................
4.00 4.00
Mortality table ................................................................
..........
RP 2000 RP 2000
(a) Amounts are recognized in noncurrent liabilities on Xcel Energy’s consolidated balance sheet.
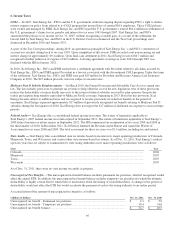
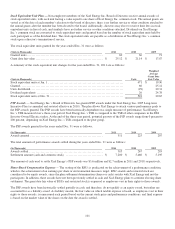
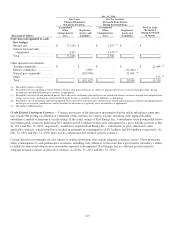
Cash Flows — Cash funding requirements can be impacted by changes to actuarial assumptions, actual asset levels and other
calculations prescribed by the funding requirements of income tax and other pension-related regulations. These regulations did
not require cash funding for 2008 through 2010 for Xcel Energy’s pension plans. Required contributions were made in 2011 and
2012 to meet minimum funding requirements.
The Pension Protection Act changed the minimum funding requirements for defined benefit pension plans beginning in 2008. The
following are the pension funding contributions, both voluntary and required, made by Xcel Energy for 2010 through 2012:
• In January 2012, contributions of $190.5 million were made across four of Xcel Energy’s pension plans;
• In 2011, contributions of $137.3 million were made across three of Xcel Energy’s pension plans;
• In 2010, contributions of $34 million were made to the Xcel Energy Pension Plan.
• For future years, we anticipate contributions will be made as necessary.
Plan Amendments — No amendments occurred during 2011 to the Xcel Energy pension plans.