Xcel Energy 2011 Annual Report Download - page 117
Download and view the complete annual report
Please find page 117 of the 2011 Xcel Energy annual report below. You can navigate through the pages in the report by either clicking on the pages listed below, or by using the keyword search tool below to find specific information within the annual report.-
 1
1 -
2
-
3
-
4
-
5
-
6
-
7
-
8
-
9
-
10
-
11
-
12
-
13
-
14
-
15
-
16
-
17
-
18
-
19
-
20
-
21
-
22
-
23
-
24
-
25
-
26
-
27
-
28
-
29
-
30
-
31
-
32
-
33
-
34
-
35
-
36
-
37
-
38
-
39
-
40
-
41
-
42
-
43
-
44
-
45
-
46
-
47
-
48
-
49
-
50
-
51
-
52
-
53
-
54
-
55
-
56
-
57
-
58
-
59
-
60
-
61
-
62
-
63
-
64
-
65
-
66
-
67
-
68
-
69
-
70
-
71
-
72
-
73
-
74
-
75
-
76
-
77
-
78
-
79
-
80
-
81
-
82
-
83
-
84
-
85
-
86
-
87
-
88
-
89
-
90
-
91
-
92
-
93
-
94
-
95
-
96
-
97
-
98
-
99
-
100
-
101
-
102
-
103
-
104
-
105
-
106
-
 107
107 -
 108
108 -
 109
109 -
 110
110 -
 111
111 -
 112
112 -
 113
113 -
 114
114 -
 115
115 -
 116
116 -
 117
117 -
 118
118 -
 119
119 -
 120
120 -
 121
121 -
 122
122 -
 123
123 -
 124
124 -
 125
125 -
 126
126 -
 127
127 -
128
-
129
-
130
-
131
-
132
-
133
-
134
-
135
-
136
-
137
-
138
-
139
-
140
-
141
-
142
-
143
-
144
-
145
-
146
-
147
-
148
-
149
-
150
-
151
-
152
-
153
-
154
-
155
-
156
-
157
-
158
-
159
-
160
-
161
-
162
-
163
-
164
-
165
 |
 |

107
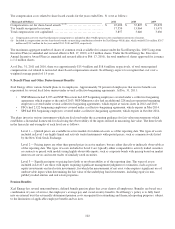
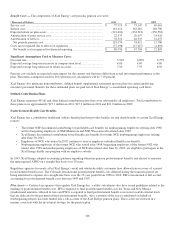
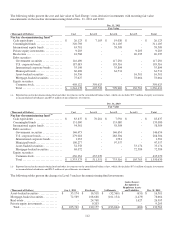
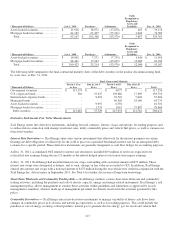
Xcel Energy bases its investment-return assumption for the postretirement health care fund assets on expected long-term
performance for each of the investment types included in its asset portfolio. The assets are invested in a portfolio according to
Xcel Energy’s return, liquidity and diversification objectives to provide a source of funding for plan obligations and minimize the
necessity of contributions to the plan, within appropriate levels of risk. The principal mechanism for achieving these objectives is
the projected allocation of assets to selected asset classes, given the long-term risk, return, correlation, and liquidity characteristics
of each particular asset class. There were no significant concentrations of risk in any particular industry, index, or entity.
Investment-return volatility is not considered to be a material factor in postretirement health care costs.
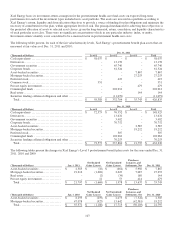
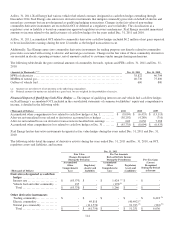
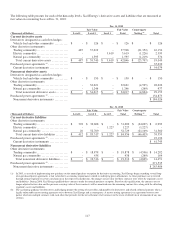
The following tables present, for each of the fair value hierarchy levels, Xcel Energy’s postretirement benefit plan assets that are
measured at fair value as of Dec. 31, 2011 and 2010:
Dec. 31, 2011
(Thousands of Dollars) Level 1 Level 2 Level 3 Total
Cash equivalents ................................
........
$
58,037 $
- $
- $
58,037
Derivatives................................
..............
- 13,178 - 13,178
Government securities ................................
...
- 65,746 - 65,746
Corporate bonds................................
.........
- 61,524 - 61,524
Asset-backed securities ................................
..
- - 7,867 7,867
Mortgage-backed securities
...............................
- - 27,253 27,253
Preferred stock ................................
..........
- 423 - 423
Common stock ................................
..........
351 - - 351
Private equity investments
................................
- - 479 479
Commingled funds ................................
......
- 202,912 - 202,912
Real estate ................................
..............
- - 144 144
Securities lending collateral obligation and other
...........
- (11,079) - (11,079)
Total ................................
.................
$
58,388 $
332,704 $
35,743 $
426,835
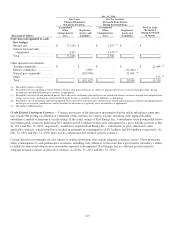
Dec. 31, 2010
(Thousands of Dollars) Level 1 Level 2 Level 3 Total
Cash equivalents ................................
........
$
72,573 $
76,352 $
- $
148,925
Derivatives................................
..............
- 13,632 - 13,632
Government securities ................................
...
- 3,402 - 3,402
Corporate bonds................................
.........
- 70,752 - 70,752
Asset-backed securities ................................
..
- - 2,585 2,585
Mortgage-backed securities
...............................
- - 19,212 19,212
Preferred stock ................................
..........
- 507 - 507
Commingled funds ................................
......
- 102,962 - 102,962
Securities lending collateral obligation and other
...........
- 70,253 - 70,253
Total ................................
.................
$
72,573 $
337,860 $
21,797 $
432,230
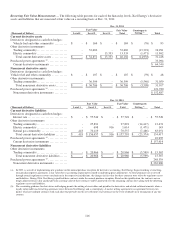
The following tables present the changes in Xcel Energy’s Level 3 postretirement benefit plan assets for the years ended Dec. 31,
2011, 2010 and 2009:
(Thousands of Dollars) Jan. 1, 2011
Net Realized
Gains (Losses)
Net Unrealized
Gains (Losses)
Purchases,
Issuances, and
Settlements, Net
Dec. 31, 2011
Asset-backed securities .................
$
2,585 $
(10) $
(664) $
5,956 $
7,867
Mortgage-backed securities..............
19,212 (1,669) 2,623 7,087 27,253
Real estate .............................
- (2) (34) 180 144
Private equity investments...............
- 12 53 414 479
Total ................................
$
21,797 $
(1,669) $
1,978 $
13,637 $
35,743
(Thousands of Dollars) Jan. 1, 2010
Net Realized
Gains (Losses)
Net Unrealized
Gains (Losses)
Purchases,
Issuances, and
Settlements, Net
Dec. 31, 2010
Asset-backed securities .................
$
8,293 $
(259) $
2,073 $
(7,522) $
2,585
Mortgage-backed securities..............
47,078 (927) 15,642 (42,581) 19,212
Total ................................
$
55,371 $
(1,186) $
17,715 $
(50,103) $
21,797