XM Radio 2012 Annual Report Download - page 92
Download and view the complete annual report
Please find page 92 of the 2012 XM Radio annual report below. You can navigate through the pages in the report by either clicking on the pages listed below, or by using the keyword search tool below to find specific information within the annual report.-
 1
1 -
2
-
3
-
4
-
5
-
6
-
7
-
8
-
9
-
10
-
11
-
12
-
13
-
14
-
15
-
16
-
17
-
18
-
19
-
20
-
21
-
22
-
23
-
24
-
25
-
26
-
27
-
28
-
29
-
30
-
31
-
32
-
33
-
34
-
35
-
36
-
37
-
38
-
39
-
40
-
41
-
42
-
43
-
44
-
45
-
46
-
47
-
48
-
49
-
50
-
51
-
52
-
53
-
54
-
55
-
56
-
57
-
58
-
59
-
60
-
61
-
62
-
63
-
64
-
65
-
66
-
67
-
68
-
69
-
70
-
71
-
72
-
73
-
74
-
75
-
76
-
77
-
78
-
79
-
80
-
81
-
 82
82 -
 83
83 -
 84
84 -
 85
85 -
 86
86 -
 87
87 -
 88
88 -
 89
89 -
 90
90 -
 91
91 -
 92
92 -
 93
93 -
 94
94 -
 95
95 -
 96
96 -
 97
97 -
 98
98 -
 99
99 -
 100
100 -
 101
101 -
 102
102 -
103
-
104
-
105
-
106
-
107
-
108
-
109
-
110
-
111
-
112
-
113
-
114
-
115
-
116
-
117
-
118
-
119
-
120
-
121
-
122
-
123
-
124
-
125
-
126
-
127
-
128
-
129
-
130
-
131
-
132
 |
 |

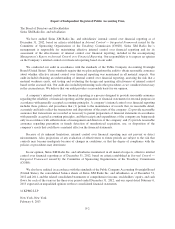
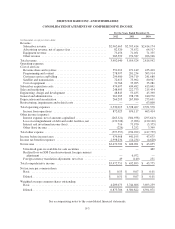
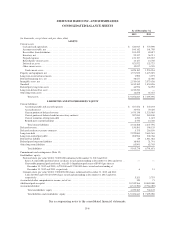
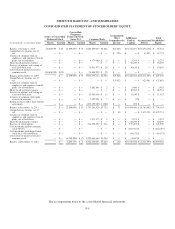
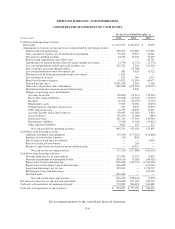
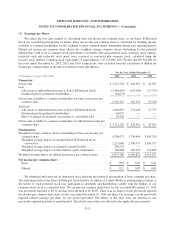
SIRIUS XM RADIO INC. AND SUBSIDIARIES
CONSOLIDATED STATEMENTS OF CASH FLOWS
For the Years Ended December 31,
(in thousands) 2012 2011 2010
Cash flows from operating activities:
Net income ....................................................... $3,472,702 $ 426,961 $ 43,055
Adjustments to reconcile net income to net cash provided by operating activities:
Depreciation and amortization ...................................... 266,295 267,880 273,691
Non-cash interest expense, net of amortization of premium ................ 35,924 39,515 42,841
Provision for doubtful accounts ..................................... 34,548 33,164 32,379
Restructuring, impairments and related costs ........................... — — 66,731
Amortization of deferred income related to equity method investment ....... (2,776) (2,776) (2,776)
Loss on extinguishment of debt and credit facilities, net .................. 132,726 7,206 120,120
Gain on merger of unconsolidated entities ............................. — (75,768) —
Loss on unconsolidated entity investments, net ......................... 420 6,520 11,722
Dividend received from unconsolidated entity investment ................. 1,185 — —
Loss on disposal of assets .......................................... 657 269 1,017
Share-based payment expense ....................................... 63,822 53,190 60,437
Deferred income taxes ............................................. (3,001,818) 8,264 2,308
Other non-cash purchase price adjustments ............................ (289,050) (275,338) (250,727)
Distribution from investment in unconsolidated entity .................... — 4,849 —
Changes in operating assets and liabilities:
Accounts receivable ............................................ (38,985) (13,211) (39,236)
Receivables from distributors ..................................... (19,608) (17,241) (11,023)
Inventory ..................................................... 11,374 (14,793) (5,725)
Related party assets ............................................. 9,523 30,036 (9,803)
Prepaid expenses and other current assets ............................ 647 8,525 75,374
Other long-term assets ........................................... 22,779 36,490 17,671
Accounts payable and accrued expenses ............................. 46,043 (32,010) 5,420
Accrued interest ................................................ (36,451) (2,048) (884)
Deferred revenue ............................................... 101,311 55,336 133,444
Related party liabilities .......................................... (7,545) (1,542) (53,413)
Other long-term liabilities ........................................ 3,042 152 272
Net cash provided by operating activities .......................... 806,765 543,630 512,895
Cash flows from investing activities:
Additions to property and equipment ................................. (97,293) (137,429) (311,868)
Purchase of restricted investments ................................... (26) (826) —
Sale of restricted and other investments ............................... — — 9,454
Release of restricted investments .................................... — 250 —
Return of capital from investment in unconsolidated entity ................ — 10,117 —
Net cash used in investing activities .............................. (97,319) (127,888) (302,414)
Cash flows from financing activities:
Proceeds from exercise of stock options ............................... 123,369 11,553 10,839
Payment of premiums on redemption of debt ........................... (100,615) (5,020) (84,326)
Repayment of long-term borrowings ................................. (915,824) (234,976) (1,262,396)
Repayment of related party long-term borrowings ....................... (126,000) — (142,221)
Long-term borrowings, net of costs .................................. 383,641 — 1,274,707
Related party long-term borrowings .................................. — — 196,118
Dividends paid ................................................... (327,062) — —
Net cash used in financing activities .............................. (962,491) (228,443) (7,279)
Net (decrease) increase in cash and cash equivalents ......................... (253,045) 187,299 203,202
Cash and cash equivalents at beginning of period ........................... 773,990 586,691 383,489
Cash and cash equivalents at end of period ................................. $ 520,945 $ 773,990 $ 586,691
See accompanying notes to the consolidated financial statements.
F-6