XM Radio 2012 Annual Report Download - page 64
Download and view the complete annual report
Please find page 64 of the 2012 XM Radio annual report below. You can navigate through the pages in the report by either clicking on the pages listed below, or by using the keyword search tool below to find specific information within the annual report.-
 1
1 -
2
-
3
-
4
-
5
-
6
-
7
-
8
-
9
-
10
-
11
-
12
-
13
-
14
-
15
-
16
-
17
-
18
-
19
-
20
-
21
-
22
-
23
-
24
-
25
-
26
-
27
-
28
-
29
-
30
-
31
-
32
-
33
-
34
-
35
-
36
-
37
-
38
-
39
-
40
-
41
-
42
-
43
-
44
-
45
-
46
-
47
-
48
-
49
-
50
-
51
-
52
-
53
-
 54
54 -
 55
55 -
 56
56 -
 57
57 -
 58
58 -
 59
59 -
 60
60 -
 61
61 -
 62
62 -
 63
63 -
 64
64 -
 65
65 -
 66
66 -
 67
67 -
 68
68 -
 69
69 -
 70
70 -
 71
71 -
 72
72 -
 73
73 -
 74
74 -
75
-
76
-
77
-
78
-
79
-
80
-
81
-
82
-
83
-
84
-
85
-
86
-
87
-
88
-
89
-
90
-
91
-
92
-
93
-
94
-
95
-
96
-
97
-
98
-
99
-
100
-
101
-
102
-
103
-
104
-
105
-
106
-
107
-
108
-
109
-
110
-
111
-
112
-
113
-
114
-
115
-
116
-
117
-
118
-
119
-
120
-
121
-
122
-
123
-
124
-
125
-
126
-
127
-
128
-
129
-
130
-
131
-
132
 |
 |
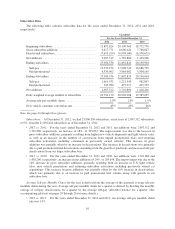
•2011 vs. 2010: For the years ended December 31, 2011 and 2010, depreciation and amortization
expense was $267,880 and $273,691, respectively, a decrease of 2%, or $5,811, and decreased as a
percentage of total revenue. The decrease was primarily due to a reduction in the amortization of
subscriber relationships, partially offset by depreciation recognized on additional assets placed in service.
We expect depreciation expense to increase in future periods as we launch our FM-6 satellite, which will be
partially offset by reduced amortization associated with the stepped-up basis in assets acquired in the Merger
(including intangible assets, satellites, property and equipment) through the end of their estimated service lives,
principally through 2017.
Restructuring, Impairments and Related Costs represents charges related to the reorganization of our staff
and restructuring of contracts, as well as charges related to the impairment of assets when those costs are deemed
to provide no future benefit.
•2012 vs. 2011: In 2012 and 2011, we did not record any restructuring, impairments and related costs.
•2011 vs. 2010: For the year ended December 31, 2010, restructuring, impairments and related costs
were $63,800 primarily due to the impairment of our FM-4 satellite as a result of the launch of our XM-5
satellite in 2010 and contract terminations.
Other Income (Expense)
Interest Expense, Net of Amounts Capitalized, includes interest on outstanding debt, reduced by interest
capitalized in connection with the construction of our satellites and related launch vehicles.
•2012 vs. 2011: For the years ended December 31, 2012 and 2011, interest expense was $265,321 and
$304,938, respectively, a decrease of 13%, or $39,617. The decrease was primarily due to a lower
average outstanding debt balance and a mix of outstanding debt with lower interest rates.
•2011 vs. 2010: For the years ended December 31, 2011 and 2010, interest expense was $304,938 and
$295,643, respectively, an increase of 3%, or $9,295. The increase was primarily due to lower capitalized
interest related to the construction of our satellites and related launch vehicles, partially offset by
outstanding debt with lower interest rates.
We expect interest expense to decrease in future periods due to debt retirements at maturity, redemptions
and repurchases in 2012. The decrease will be partially offset by a decrease in capitalized interest following the
launch of our FM-6 satellite.
Loss on Extinguishment of Debt and Credit Facilities, Net, includes losses incurred as a result of the
conversion and retirement of certain debt.
•2012 vs. 2011: For the year ended December 31, 2012, loss on extinguishment of debt and credit
facilities, net, was $132,726. The loss was recorded on the repayment of our 13% Senior Notes due 2013
and our 9.75% Senior Secured Notes due 2015. During the year ended December 31, 2011, a $7,206 loss
was recorded on the repayment of our 11.25% Senior Secured Notes due 2013 and our 3.25% Convertible
Notes due 2011.
•2011 vs. 2010: For the year ended December 31, 2011, loss on extinguishment of debt and credit
facilities, net, was $7,206. During the year ended December 31, 2010, a $120,120 loss was recorded on
the repayment of our Senior Secured Term Loan due 2012 and 9.625% Senior Notes due 2013 and XM’s
10% Senior PIK Secured Notes due 2011 and 9.75% Senior Notes due 2014, as well as the partial
repayment of XM’s 11.25% Senior Secured Notes due 2013 and our 3.25% Convertible Notes due 2011.
8