XM Radio 2012 Annual Report Download - page 59
Download and view the complete annual report
Please find page 59 of the 2012 XM Radio annual report below. You can navigate through the pages in the report by either clicking on the pages listed below, or by using the keyword search tool below to find specific information within the annual report.-
 1
1 -
2
-
3
-
4
-
5
-
6
-
7
-
8
-
9
-
10
-
11
-
12
-
13
-
14
-
15
-
16
-
17
-
18
-
19
-
20
-
21
-
22
-
23
-
24
-
25
-
26
-
27
-
28
-
29
-
30
-
31
-
32
-
33
-
34
-
35
-
36
-
37
-
38
-
39
-
40
-
41
-
42
-
43
-
44
-
45
-
46
-
47
-
48
-
 49
49 -
 50
50 -
 51
51 -
 52
52 -
 53
53 -
 54
54 -
 55
55 -
 56
56 -
 57
57 -
 58
58 -
 59
59 -
 60
60 -
 61
61 -
 62
62 -
 63
63 -
 64
64 -
 65
65 -
 66
66 -
 67
67 -
 68
68 -
 69
69 -
70
-
71
-
72
-
73
-
74
-
75
-
76
-
77
-
78
-
79
-
80
-
81
-
82
-
83
-
84
-
85
-
86
-
87
-
88
-
89
-
90
-
91
-
92
-
93
-
94
-
95
-
96
-
97
-
98
-
99
-
100
-
101
-
102
-
103
-
104
-
105
-
106
-
107
-
108
-
109
-
110
-
111
-
112
-
113
-
114
-
115
-
116
-
117
-
118
-
119
-
120
-
121
-
122
-
123
-
124
-
125
-
126
-
127
-
128
-
129
-
130
-
131
-
132
 |
 |
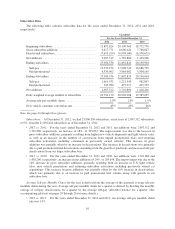
Total Revenue
Subscriber Revenue includes subscription, activation and other fees.
•2012 vs. 2011: For the years ended December 31, 2012 and 2011, subscriber revenue was $2,962,665
and $2,595,414, respectively, an increase of 14%, or $367,251. The increase was primarily attributable to
a 9% increase in daily weighted average number of subscribers, the increase in certain of our subscription
rates beginning in January 2012, and an increase in subscriptions to premium services, including Premier
packages, data services and Internet streaming. The increase was partially offset by subscription discounts
offered through customer acquisition and retention programs.
•2011 vs. 2010: For the years ended December 31, 2011 and 2010, subscriber revenue was $2,595,414
and $2,414,174, respectively, an increase of 8%, or $181,240. The increase was primarily attributable to
an increase of 8% in daily weighted average number of subscribers and an increase in subscriptions to
premium services, including Premier packages, data services and Internet subscriptions, partially offset
by the impact of subscription discounts offered through customer acquisition and retention programs.
We expect subscriber revenues to grow based on the growth of our subscriber base, promotions, plan mix,
subscription prices and identification of additional revenue streams from subscribers.
Advertising Revenue includes the sale of advertising on certain non-music channels, net of agency fees.
Agency fees are based on a contractual percentage of the gross advertising revenue.
•2012 vs. 2011: For the years ended December 31, 2012 and 2011, advertising revenue was $82,320 and
$73,672, respectively, an increase of 12%, or $8,648. The increase was primarily due to a greater number
of advertising spots sold and broadcast, as well as increases in rates charged per spot.
•2011 vs. 2010: For the years ended December 31, 2011 and 2010, advertising revenue was $73,672 and
$64,517, respectively, an increase of 14%, or $9,155. The increase was primarily due to a greater number
of advertising spots sold and broadcast, as well as increases in rates charged per spot.
We expect our advertising revenue to grow as advertisers are attracted to our platform by the increase in our
subscriber base.
Equipment Revenue includes revenue and royalties from the sale of satellite radios, components and
accessories.
•2012 vs. 2011: For the years ended December 31, 2012 and 2011, equipment revenue was $73,456 and
$71,051, respectively, an increase of 3%, or $2,405. The increase was driven by royalties from higher
OEM production, offset by lower direct to consumer sales.
•2011 vs. 2010: For the years ended December 31, 2011 and 2010, equipment revenue was $71,051 and
$71,355, respectively, a decrease of $304. The decrease was driven by a reduction in aftermarket
hardware subsidies earned, partially offset by increased royalties from higher OEM production.
We expect equipment revenue to fluctuate based on OEM production for which we receive royalty
payments for our technology and, to a lesser extent, on the volume and mix of equipment sales in our aftermarket
and direct to consumer business.
Other Revenue includes amounts earned from subscribers for the U.S. Music Royalty Fee, revenue from our
Canadian affiliate and ancillary revenues.
•2012 vs. 2011: For the years ended December 31, 2012 and 2011, other revenue was $283,599 and
$274,387, respectively, an increase of 3%, or $9,212. The increase was driven by revenues from the U.S.
Music Royalty Fee as the number of subscribers increased, and higher royalty revenue from Sirius XM
Canada.
•2011 vs. 2010: For the years ended December 31, 2011 and 2010, other revenue was $274,387 and
$266,946, respectively, an increase of 3%, or $7,441. The increase was primarily due to higher royalty
3