XM Radio 2012 Annual Report Download - page 60
Download and view the complete annual report
Please find page 60 of the 2012 XM Radio annual report below. You can navigate through the pages in the report by either clicking on the pages listed below, or by using the keyword search tool below to find specific information within the annual report.-
 1
1 -
2
-
3
-
4
-
5
-
6
-
7
-
8
-
9
-
10
-
11
-
12
-
13
-
14
-
15
-
16
-
17
-
18
-
19
-
20
-
21
-
22
-
23
-
24
-
25
-
26
-
27
-
28
-
29
-
30
-
31
-
32
-
33
-
34
-
35
-
36
-
37
-
38
-
39
-
40
-
41
-
42
-
43
-
44
-
45
-
46
-
47
-
48
-
49
-
 50
50 -
 51
51 -
 52
52 -
 53
53 -
 54
54 -
 55
55 -
 56
56 -
 57
57 -
 58
58 -
 59
59 -
 60
60 -
 61
61 -
 62
62 -
 63
63 -
 64
64 -
 65
65 -
 66
66 -
 67
67 -
 68
68 -
 69
69 -
 70
70 -
71
-
72
-
73
-
74
-
75
-
76
-
77
-
78
-
79
-
80
-
81
-
82
-
83
-
84
-
85
-
86
-
87
-
88
-
89
-
90
-
91
-
92
-
93
-
94
-
95
-
96
-
97
-
98
-
99
-
100
-
101
-
102
-
103
-
104
-
105
-
106
-
107
-
108
-
109
-
110
-
111
-
112
-
113
-
114
-
115
-
116
-
117
-
118
-
119
-
120
-
121
-
122
-
123
-
124
-
125
-
126
-
127
-
128
-
129
-
130
-
131
-
132
 |
 |
revenue from Sirius XM Canada. While the number of subscribers subject to the U.S. Music Royalty Fee
increased, that increase was offset by a reduction in December 2010 in the rate charged on primary
subscriptions.
Other revenue is dependent upon the U.S. Music Royalty Fee and the royalty from our Canadian affiliate.
We expect other revenue to increase as our subscriber base drives higher U.S. Music Royalty Fees and as the
performance of our Canadian affiliate improves.
Operating Expenses
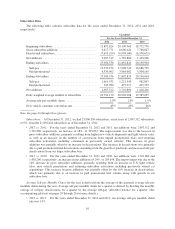
Revenue Share and Royalties include distribution and content provider revenue share, advertising revenue
share, and broadcast and web streaming royalties. Advertising revenue share is recognized in revenue share and
royalties in the period in which the advertising is broadcast.
•2012 vs. 2011: For the years ended December 31, 2012 and 2011, revenue share and royalties were
$551,012 and $471,149, respectively, an increase of 17%, or $79,863, and increased as a percentage of
total revenue. The increase was primarily attributable to greater revenues subject to royalty and/or
revenue sharing arrangements and a 7% increase in the statutory royalty rate for the performance of sound
recordings, partially offset by an increase in the benefit to earnings from the amortization of deferred
credits on executory contracts initially recognized in purchase price accounting associated with the
Merger.
•2011 vs. 2010: For the years ended December 31, 2011 and 2010, revenue share and royalties were
$471,149 and $435,410, respectively, an increase of 8%, or $35,739. For the year ended December 31,
2011, revenue share and royalties remained flat as a percentage of total revenue. The increase in revenue
share and royalties was primarily attributable to a 14% increase in our revenues subject to royalty and/or
revenue sharing arrangements and a 7% increase in the statutory royalty rate for the performance of sound
recordings, partially offset by a $18,974 increase in the benefit to earnings from the amortization of
deferred credits on executory contracts initially recognized in purchase price accounting associated with
the Merger.
We expect our revenue share and royalty costs to increase as our revenues grow. Under the terms of the
Copyright Royalty Board’s decision, we paid royalties of 8.0% and 7.5% of gross revenues, subject to certain
exclusions, for the years ended December 31, 2012, and 2011, respectively, and will pay 9.0% in 2013. The
deferred credits on executory contracts initially recognized in purchase price accounting associated with the
Merger are expected to provide increasing benefits to revenue share and royalties through the expiration of the
acquired executory contracts in 2013.
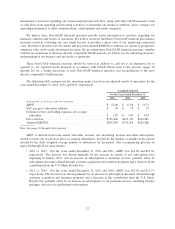
Programming and Content includes costs to acquire, create, promote and produce content. We have entered
into various agreements with third parties for music and non-music programming that require us to pay license
fees, purchase advertising on media properties owned or controlled by the licensor, which is allocated to sales
and marketing, and pay other guaranteed amounts.
•2012 vs. 2011: For the years ended December 31, 2012 and 2011, programming and content expenses
were $278,997 and $281,234, respectively, a decrease of 1%, or $2,237, and decreased as a percentage of
total revenue. The decrease was primarily due to savings in content agreements, partially offset by
increases in personnel costs and reductions in the benefit to earnings from purchase price accounting
adjustments associated with the Merger attributable to the amortization of the deferred credit on acquired
programming executory contracts.
•2011 vs. 2010: For the years ended December 31, 2011 and 2010, programming and content expenses
were $281,234 and $305,914, respectively, a decrease of 8%, or $24,680, and decreased as a percentage
of total revenue. The decrease was primarily due to savings in content agreements and production costs,
4