XM Radio 2012 Annual Report Download - page 69
Download and view the complete annual report
Please find page 69 of the 2012 XM Radio annual report below. You can navigate through the pages in the report by either clicking on the pages listed below, or by using the keyword search tool below to find specific information within the annual report.-
 1
1 -
2
-
3
-
4
-
5
-
6
-
7
-
8
-
9
-
10
-
11
-
12
-
13
-
14
-
15
-
16
-
17
-
18
-
19
-
20
-
21
-
22
-
23
-
24
-
25
-
26
-
27
-
28
-
29
-
30
-
31
-
32
-
33
-
34
-
35
-
36
-
37
-
38
-
39
-
40
-
41
-
42
-
43
-
44
-
45
-
46
-
47
-
48
-
49
-
50
-
51
-
52
-
53
-
54
-
55
-
56
-
57
-
58
-
 59
59 -
 60
60 -
 61
61 -
 62
62 -
 63
63 -
 64
64 -
 65
65 -
 66
66 -
 67
67 -
 68
68 -
 69
69 -
 70
70 -
 71
71 -
 72
72 -
 73
73 -
 74
74 -
 75
75 -
 76
76 -
 77
77 -
 78
78 -
 79
79 -
80
-
81
-
82
-
83
-
84
-
85
-
86
-
87
-
88
-
89
-
90
-
91
-
92
-
93
-
94
-
95
-
96
-
97
-
98
-
99
-
100
-
101
-
102
-
103
-
104
-
105
-
106
-
107
-
108
-
109
-
110
-
111
-
112
-
113
-
114
-
115
-
116
-
117
-
118
-
119
-
120
-
121
-
122
-
123
-
124
-
125
-
126
-
127
-
128
-
129
-
130
-
131
-
132
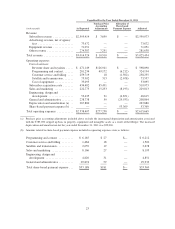
 |
 |
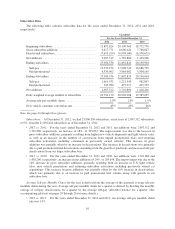
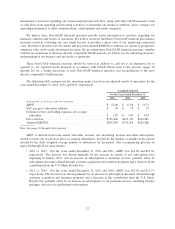
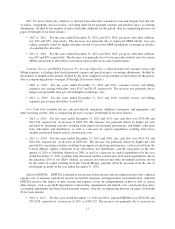
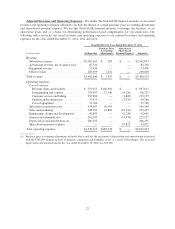
SAC, Per Gross Subscriber Addition, is derived from subscriber acquisition costs and margins from the sale
of radios, components and accessories, excluding share-based payment expense and purchase price accounting
adjustments, divided by the number of gross subscriber additions for the period. (See accompanying glossary on
pages 20 through 26 for more details.)
•2012 vs. 2011: For the years ended December 31, 2012 and 2011, SAC, per gross subscriber addition,
was $54 and $55, respectively. The decrease was primarily due to improved OEM subsidy rates per
vehicle, partially offset by higher subsidies related to increased OEM installations occurring in advance
of acquiring the subscriber.
•2011 vs. 2010: For the years ended December 31, 2011 and 2010, SAC, per gross subscriber addition,
was $55 and $59, respectively. The decrease was primarily due to lower per radio subsidy rates for certain
OEMs and growth in subscriber reactivations and royalties from radio manufacturers.
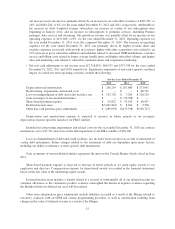
Customer Service and Billing Expenses, Per Average Subscriber, is derived from total customer service and
billing expenses, excluding share-based payment expense and purchase price accounting adjustments, divided by
the number of months in the period, divided by the daily weighted average number of subscribers for the period.
(See accompanying glossary on pages 20 through 26 for more details.)
•2012 vs. 2011: For the years ended December 31, 2012 and 2011, customer service and billing
expenses, per average subscriber, were $1.07 and $1.03, respectively. The increase was primarily due to
longer average handle time per call and higher technology costs.
•2011 vs. 2010: For the years ended December 31, 2011 and 2010, customer service and billing
expenses, per average subscriber, were $1.03.
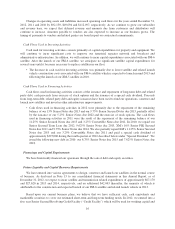
Free Cash Flow includes the net cash provided by operations, additions to property and equipment, and
other investing activity. (See accompanying glossary on pages 20 through 26 for more details.)
•2012 vs. 2011: For the years ended December 31, 2012 and 2011, free cash flow was $709,446 and
$415,742, respectively, an increase of $293,704. The increase was primarily driven by higher net cash
provided by operating activities resulting from improved operating performance and higher collections
from subscribers and distributors, as well as a decrease in capital expenditures resulting from lower
satellite and related launch vehicle construction costs.
•2011 vs. 2010: For the years ended December 31, 2011 and 2010, free cash flow was $415,742 and
$210,481, respectively, an increase of $205,261. The increase was primarily driven by higher net cash
provided by operating activities resulting from improved operating performance, cash received from the
Canada Merger, higher collections from subscribers and distributors, and the repayment in the first
quarter of 2010 of liabilities deferred in 2009, as well as a decrease in capital expenditures for the year
ended December 31, 2011 resulting from decreased satellite construction and launch expenditures due to
the launch in 2010 of our XM-5 satellite, an increase in restricted and other investment activities driven
by the return of capital resulting from the Canada Merger; partially offset by proceeds from the sale of
investment securities in the year ended December 31, 2010.
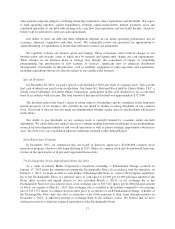
Adjusted EBITDA. EBITDA is defined as net income before interest and investment income (loss); interest
expense, net of amounts capitalized; income tax benefit (expense) and depreciation and amortization. Adjusted
EBITDA removes the impact of other income and expense, losses on extinguishment of debt as well as certain
other charges, such as goodwill impairment; restructuring, impairments and related costs; certain purchase price
accounting adjustments and share-based payment expense. (See the accompanying glossary on pages 20 through
26 for more details):
•2012 vs. 2011: For the years ended December 31, 2012 and 2011, adjusted EBITDA was $920,343 and
$731,018, respectively, an increase of 26%, or $189,325. The increase was primarily due to increases in
13