XM Radio 2012 Annual Report Download - page 118
Download and view the complete annual report
Please find page 118 of the 2012 XM Radio annual report below. You can navigate through the pages in the report by either clicking on the pages listed below, or by using the keyword search tool below to find specific information within the annual report.-
 1
1 -
2
-
3
-
4
-
5
-
6
-
7
-
8
-
9
-
10
-
11
-
12
-
13
-
14
-
15
-
16
-
17
-
18
-
19
-
20
-
21
-
22
-
23
-
24
-
25
-
26
-
27
-
28
-
29
-
30
-
31
-
32
-
33
-
34
-
35
-
36
-
37
-
38
-
39
-
40
-
41
-
42
-
43
-
44
-
45
-
46
-
47
-
48
-
49
-
50
-
51
-
52
-
53
-
54
-
55
-
56
-
57
-
58
-
59
-
60
-
61
-
62
-
63
-
64
-
65
-
66
-
67
-
68
-
69
-
70
-
71
-
72
-
73
-
74
-
75
-
76
-
77
-
78
-
79
-
80
-
81
-
82
-
83
-
84
-
85
-
86
-
87
-
88
-
89
-
90
-
91
-
92
-
93
-
94
-
95
-
96
-
97
-
98
-
99
-
100
-
101
-
102
-
103
-
104
-
105
-
106
-
107
-
 108
108 -
 109
109 -
 110
110 -
 111
111 -
 112
112 -
 113
113 -
 114
114 -
 115
115 -
 116
116 -
 117
117 -
 118
118 -
 119
119 -
 120
120 -
 121
121 -
 122
122 -
 123
123 -
 124
124 -
 125
125 -
 126
126 -
 127
127 -
 128
128 -
129
-
130
-
131
-
132
 |
 |

SIRIUS XM RADIO INC. AND SUBSIDIARIES
NOTES TO CONSOLIDATED FINANCIAL STATEMENTS — (Continued)
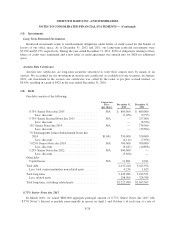
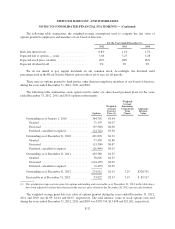
The following table summarizes the weighted-average assumptions used to compute the fair value of
options granted to employees and members of our board of directors:
For the Years Ended December 31,
2012 2011 2010
Risk-free interest rate ........................... 0.8% 1.1% 1.7%
Expected life of options — years ................. 5.06 5.27 5.28
Expected stock price volatility ................... 49% 68% 85%
Expected dividend yield ........................ 0% 0% 0%
We do not intend to pay regular dividends on our common stock. Accordingly, the dividend yield
percentage used in the Black-Scholes-Merton option value is set to zero for all periods.
There were no options granted to third parties, other than non-employee members of our board of directors,
during the years ended December 31, 2012, 2011 and 2010.
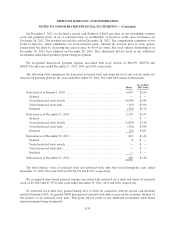
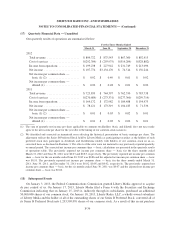
The following table summarizes stock option activity under our share-based payment plans for the years
ended December 31, 2012, 2011 and 2010 (options in thousands):
Options
Weighted-
Average
Exercise
Price (1)
Weighted-
Average
Remaining
Contractual
Term
(Years)
Aggregate
Intrinsic
Value
Outstanding as of January 1, 2010 ............. 364,792 $1.44
Granted ................................ 71,179 $0.97
Exercised ............................... (19,360) $0.56
Forfeited, cancelled or expired .............. (14,741) $3.58
Outstanding as of December 31, 2010 .......... 401,870 $1.32
Granted ................................ 77,450 $1.80
Exercised ............................... (13,300) $0.87
Forfeited, cancelled or expired .............. (26,440) $4.15
Outstanding as of December 31, 2011 .......... 439,580 $1.25
Granted ................................ 58,626 $2.53
Exercised ............................... (214,199) $0.59
Forfeited, cancelled or expired .............. (9,495) $3.09
Outstanding as of December 31, 2012 .......... 274,512 $1.92 7.29 $320,751
Exercisable as of December 31, 2012 ........... 93,822 $2.53 5.19 $ 89,517
(1) The weighted-average exercise price for options outstanding and exercisable as of December 31, 2012 in the table above
have been adjusted to reflect the reduction to the exercise price related to the December 28, 2012 special cash dividend.
The weighted average grant date fair value of options granted during the years ended December 31, 2012,
2011 and 2010 was $1.09, $1.04 and $0.67, respectively. The total intrinsic value of stock options exercised
during the years ended December 31, 2012, 2011 and 2010 was $399,794, $13,408 and $13,261, respectively.
F-32