XM Radio 2012 Annual Report Download - page 58
Download and view the complete annual report
Please find page 58 of the 2012 XM Radio annual report below. You can navigate through the pages in the report by either clicking on the pages listed below, or by using the keyword search tool below to find specific information within the annual report.-
 1
1 -
2
-
3
-
4
-
5
-
6
-
7
-
8
-
9
-
10
-
11
-
12
-
13
-
14
-
15
-
16
-
17
-
18
-
19
-
20
-
21
-
22
-
23
-
24
-
25
-
26
-
27
-
28
-
29
-
30
-
31
-
32
-
33
-
34
-
35
-
36
-
37
-
38
-
39
-
40
-
41
-
42
-
43
-
44
-
45
-
46
-
47
-
 48
48 -
 49
49 -
 50
50 -
 51
51 -
 52
52 -
 53
53 -
 54
54 -
 55
55 -
 56
56 -
 57
57 -
 58
58 -
 59
59 -
 60
60 -
 61
61 -
 62
62 -
 63
63 -
 64
64 -
 65
65 -
 66
66 -
 67
67 -
 68
68 -
69
-
70
-
71
-
72
-
73
-
74
-
75
-
76
-
77
-
78
-
79
-
80
-
81
-
82
-
83
-
84
-
85
-
86
-
87
-
88
-
89
-
90
-
91
-
92
-
93
-
94
-
95
-
96
-
97
-
98
-
99
-
100
-
101
-
102
-
103
-
104
-
105
-
106
-
107
-
108
-
109
-
110
-
111
-
112
-
113
-
114
-
115
-
116
-
117
-
118
-
119
-
120
-
121
-
122
-
123
-
124
-
125
-
126
-
127
-
128
-
129
-
130
-
131
-
132
 |
 |

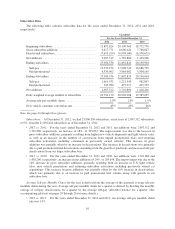
Results of Operations
Set forth below are our results of operations for the year ended December 31, 2012 compared with the year
ended December 31, 2011 and the year ended December 31, 2011 compared with the year ended December 31,
2010.
For the Years Ended December 31, 2012 vs 2011 Change
2011 vs 2010
Change
2012 2011 2010 Amount % Amount %
Revenue:
Subscriber revenue ........ $2,962,665 $2,595,414 $2,414,174 $ 367,251 14% $181,240 8%
Advertising revenue, net of
agency fees ............ 82,320 73,672 64,517 8,648 12% 9,155 14%
Equipment revenue ........ 73,456 71,051 71,355 2,405 3 % (304) —
Other revenue ............ 283,599 274,387 266,946 9,212 3 % 7,441 3%
Total revenue ............... 3,402,040 3,014,524 2,816,992 387,516 13% 197,532 7%
Operating expenses:
Cost of services:
Revenue share and
royalties ............... 551,012 471,149 435,410 79,863 17% 35,739 8%
Programming and content . . . 278,997 281,234 305,914 (2,237) (1)% (24,680) (8)%
Customer service and
billing ................ 294,980 259,719 241,680 35,261 14% 18,039 7%
Satellite and transmission . . . 72,615 75,902 80,947 (3,287) (4)% (5,045) (6)%
Cost of equipment ......... 31,766 33,095 35,281 (1,329) (4)% (2,186) (6)%
Subscriber acquisition costs . . . 474,697 434,482 413,041 40,215 9 % 21,441 5%
Sales and marketing ......... 248,905 222,773 215,454 26,132 12% 7,319 3%
Engineering, design and
development ............. 48,843 53,435 45,390 (4,592) (9)% 8,045 18%
General and administrative .... 261,905 238,738 240,970 23,167 10% (2,232) (1)%
Depreciation and
amortization .............. 266,295 267,880 273,691 (1,585) (1)% (5,811) (2)%
Restructuring, impairments and
related costs .............. — — 63,800 — nm (63,800) nm
Total operating expenses ...... 2,530,015 2,338,407 2,351,578 191,608 8% (13,171) (1)%
Income from operations .... 872,025 676,117 465,414 195,908 29% 210,703 45%
Other income (expense):
Interest expense, net of
amounts capitalized ...... (265,321) (304,938) (295,643) 39,617 13% (9,295) (3)%
Loss on extinguishment of
debt and credit facilities,
net ................... (132,726) (7,206) (120,120) (125,520) nm 112,914 94%
Interest and investment
income (loss) ........... 716 73,970 (5,375) (73,254) (99)% 79,345 nm
Other (loss) income ........ (226) 3,252 3,399 (3,478) (107)% (147) (4)%
Total other expense .......... (397,557) (234,922) (417,739) (162,635) (69)% 182,817 44%
Income before income taxes . . . 474,468 441,195 47,675 33,273 8% 393,520 825%
Income tax benefit (expense) . . 2,998,234 (14,234) (4,620) 3,012,468 nm (9,614) (208)%
Net income ................ $3,472,702 $ 426,961 $ 43,055 $3,045,741 713% $383,906 892%
nm — not meaningful
2