XM Radio 2012 Annual Report Download - page 66
Download and view the complete annual report
Please find page 66 of the 2012 XM Radio annual report below. You can navigate through the pages in the report by either clicking on the pages listed below, or by using the keyword search tool below to find specific information within the annual report.-
 1
1 -
2
-
3
-
4
-
5
-
6
-
7
-
8
-
9
-
10
-
11
-
12
-
13
-
14
-
15
-
16
-
17
-
18
-
19
-
20
-
21
-
22
-
23
-
24
-
25
-
26
-
27
-
28
-
29
-
30
-
31
-
32
-
33
-
34
-
35
-
36
-
37
-
38
-
39
-
40
-
41
-
42
-
43
-
44
-
45
-
46
-
47
-
48
-
49
-
50
-
51
-
52
-
53
-
54
-
55
-
 56
56 -
 57
57 -
 58
58 -
 59
59 -
 60
60 -
 61
61 -
 62
62 -
 63
63 -
 64
64 -
 65
65 -
 66
66 -
 67
67 -
 68
68 -
 69
69 -
 70
70 -
 71
71 -
 72
72 -
 73
73 -
 74
74 -
 75
75 -
 76
76 -
77
-
78
-
79
-
80
-
81
-
82
-
83
-
84
-
85
-
86
-
87
-
88
-
89
-
90
-
91
-
92
-
93
-
94
-
95
-
96
-
97
-
98
-
99
-
100
-
101
-
102
-
103
-
104
-
105
-
106
-
107
-
108
-
109
-
110
-
111
-
112
-
113
-
114
-
115
-
116
-
117
-
118
-
119
-
120
-
121
-
122
-
123
-
124
-
125
-
126
-
127
-
128
-
129
-
130
-
131
-
132
 |
 |

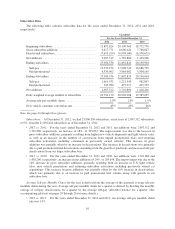
Subscriber Data
The following table contains subscriber data for the years ended December 31, 2012, 2011 and 2010,
respectively:
Unaudited
For the Years Ended December 31,
2012 2011 2010
Beginning subscribers ............................. 21,892,824 20,190,964 18,772,758
Gross subscriber additions ......................... 9,617,771 8,696,020 7,768,827
Deactivated subscribers ............................ (7,610,259) (6,994,160) (6,350,621)
Net additions .................................... 2,007,512 1,701,860 1,418,206
Ending subscribers ............................... 23,900,336 21,892,824 20,190,964
Self-pay ...................................... 19,570,274 17,908,742 16,686,799
Paid promotional ............................... 4,330,062 3,984,082 3,504,165
Ending subscribers ............................... 23,900,336 21,892,824 20,190,964
Self-pay ...................................... 1,661,532 1,221,943 982,867
Paid promotional ............................... 345,980 479,917 435,339
Net additions .................................... 2,007,512 1,701,860 1,418,206
Daily weighted average number of subscribers ......... 22,794,170 20,903,908 19,385,055
Average self-pay monthly churn ..................... 1.9% 1.9% 1.9%
New vehicle consumer conversion rate ................ 45% 45% 46%
Note: See pages 20 through 26 for glossary.
Subscribers. At December 31, 2012, we had 23,900,336 subscribers, an increase of 2,007,512 subscribers,
or 9%, from the 21,892,824 subscribers as of December 31, 2011.
•2012 vs. 2011: For the years ended December 31, 2012 and 2011, net additions were 2,007,512 and
1,701,860, respectively, an increase of 18%, or 305,652. The improvement was due to the increase in
gross subscriber additions, primarily resulting from higher new vehicle shipments and light vehicle sales,
as well as an increase in the number of conversions from unpaid promotional trials and returning
subscriber activations, including consumers in previously owned vehicles. This increase in gross
additions was partially offset by an increase in deactivations. The increase in deactivations was primarily
due to paid promotional trial deactivations stemming from the growth of paid trials and increased self-pay
deactivations from our larger subscriber base.
•2011 vs. 2010: For the years ended December 31, 2011 and 2010, net additions were 1,701,860 and
1,418,206, respectively, an increase in net additions of 20%, or 283,654. The improvement was due to the
12% increase in gross subscriber additions, primarily resulting from an increase in U.S. light vehicle
sales, new vehicle penetration, and returning subscriber activations including previously owned car
acquisitions. This increase in gross additions was partially offset by the 10% increase in deactivations,
which was primarily due to an increase in paid promotional trial volume along with growth in our
subscriber base.
Average Self-pay Monthly Churn for the year is derived from the average of the quarterly average self-pay
monthly churn during the year. Average self-pay monthly churn for a quarter is derived by dividing the monthly
average of self-pay deactivations for a quarter by the average self-pay subscriber balance for a quarter. (See
accompanying glossary on pages 20 through 26 for more details.)
•2012 vs. 2011: For the years ended December 31, 2012 and 2011, our average self-pay monthly churn
rate was 1.9%.
10