XM Radio 2012 Annual Report Download - page 65
Download and view the complete annual report
Please find page 65 of the 2012 XM Radio annual report below. You can navigate through the pages in the report by either clicking on the pages listed below, or by using the keyword search tool below to find specific information within the annual report.-
 1
1 -
2
-
3
-
4
-
5
-
6
-
7
-
8
-
9
-
10
-
11
-
12
-
13
-
14
-
15
-
16
-
17
-
18
-
19
-
20
-
21
-
22
-
23
-
24
-
25
-
26
-
27
-
28
-
29
-
30
-
31
-
32
-
33
-
34
-
35
-
36
-
37
-
38
-
39
-
40
-
41
-
42
-
43
-
44
-
45
-
46
-
47
-
48
-
49
-
50
-
51
-
52
-
53
-
54
-
 55
55 -
 56
56 -
 57
57 -
 58
58 -
 59
59 -
 60
60 -
 61
61 -
 62
62 -
 63
63 -
 64
64 -
 65
65 -
 66
66 -
 67
67 -
 68
68 -
 69
69 -
 70
70 -
 71
71 -
 72
72 -
 73
73 -
 74
74 -
 75
75 -
76
-
77
-
78
-
79
-
80
-
81
-
82
-
83
-
84
-
85
-
86
-
87
-
88
-
89
-
90
-
91
-
92
-
93
-
94
-
95
-
96
-
97
-
98
-
99
-
100
-
101
-
102
-
103
-
104
-
105
-
106
-
107
-
108
-
109
-
110
-
111
-
112
-
113
-
114
-
115
-
116
-
117
-
118
-
119
-
120
-
121
-
122
-
123
-
124
-
125
-
126
-
127
-
128
-
129
-
130
-
131
-
132
 |
 |
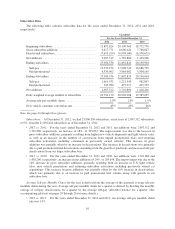
Interest and Investment Income (Loss) includes realized gains and losses, dividends, interest income, our
share of Sirius Canada’s and XM Canada’s pre-Merger net losses, and our share of the income (loss) of Sirius
XM Canada.
•2012 vs. 2011: For the year ended December 31, 2012, interest and investment income was $716
compared to $73,970 in 2011. The interest and investment income for 2012 was primarily due to interest
on our investments and our share of Sirius XM Canada’s net income, partially offset by the amortization
expense related to our equity method intangible assets. The interest and investment income for 2011 was
primarily due to income from our interests in Sirius XM Canada due to the realized net gain from the
Canada Merger in the second quarter of 2011.
•2011 vs. 2010: For the years ended December 31, 2011 and 2010, interest and investment income (loss)
was $73,970 and $(5,375), respectively, an increase of $79,345. The increase was attributable to a net
gain realized as a result of the Canada Merger. This transaction resulted in the recognition of a $75,768
gain recorded in interest and investment income. The gain was partially offset by our share of net losses
at our Canadian affiliate.
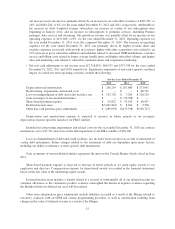
Income Taxes
Income Tax Benefit (Expense) includes the reversal of substantially all of our deferred income tax valuation
allowance, the change in our deferred tax liability related to the difference in accounting for our FCC licenses,
which are amortized over 15 years for tax purposes but not amortized for book purposes in accordance with
GAAP, foreign withholding taxes on royalty income, and the effect of changes in certain state laws related to the
utilization of net operating losses (“NOLs”).
•2012 vs. 2011: For the year ended December 31, 2012, income tax benefit was $2,998,234 compared to
income tax expense of $(14,234) for 2011. For the year ended December 31, 2012, we released
$3,195,651 of valuation allowance due to the cumulative positive evidence that it is more likely than not
that our deferred tax assets will be realized.
•2011 vs. 2010: For the years ended December 31, 2011 and 2010, income tax expense was $14,234 and
$4,620, respectively, an increase of 208%, or $9,614, primarily due to an increase in the applicable state
effective tax rates, foreign withholding taxes on royalty income and the state tax impact of the suspension
of NOL use in California and Illinois.
As of December 31, 2012, the deferred tax asset valuation allowance of $9,835 relates to deferred tax assets
that are not likely to be realized due to certain state NOL limitations.
9