XM Radio 2012 Annual Report Download - page 71
Download and view the complete annual report
Please find page 71 of the 2012 XM Radio annual report below. You can navigate through the pages in the report by either clicking on the pages listed below, or by using the keyword search tool below to find specific information within the annual report.-
 1
1 -
2
-
3
-
4
-
5
-
6
-
7
-
8
-
9
-
10
-
11
-
12
-
13
-
14
-
15
-
16
-
17
-
18
-
19
-
20
-
21
-
22
-
23
-
24
-
25
-
26
-
27
-
28
-
29
-
30
-
31
-
32
-
33
-
34
-
35
-
36
-
37
-
38
-
39
-
40
-
41
-
42
-
43
-
44
-
45
-
46
-
47
-
48
-
49
-
50
-
51
-
52
-
53
-
54
-
55
-
56
-
57
-
58
-
59
-
60
-
 61
61 -
 62
62 -
 63
63 -
 64
64 -
 65
65 -
 66
66 -
 67
67 -
 68
68 -
 69
69 -
 70
70 -
 71
71 -
 72
72 -
 73
73 -
 74
74 -
 75
75 -
 76
76 -
 77
77 -
 78
78 -
 79
79 -
 80
80 -
 81
81 -
82
-
83
-
84
-
85
-
86
-
87
-
88
-
89
-
90
-
91
-
92
-
93
-
94
-
95
-
96
-
97
-
98
-
99
-
100
-
101
-
102
-
103
-
104
-
105
-
106
-
107
-
108
-
109
-
110
-
111
-
112
-
113
-
114
-
115
-
116
-
117
-
118
-
119
-
120
-
121
-
122
-
123
-
124
-
125
-
126
-
127
-
128
-
129
-
130
-
131
-
132
 |
 |

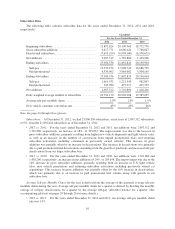
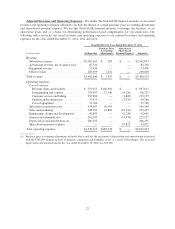
our increase in net income was primarily driven by an increase in our subscriber revenues of $367,251, or
14%, and $181,240, or 8%, for the years ended December 31, 2012 and 2011, respectively, attributable to
the increase in daily weighted average subscribers, an increase in certain of our subscription rates
beginning in January 2012, and an increase in subscriptions to premium services, including Premier
packages, data services and streaming. Our growth in revenue was partially offset by an increase in our
operating expenses of $191,608, or 8%, for the year ended December 31, 2012. Operating expenses for
the year ended December 31, 2011 were flat compared December 31, 2010. The increase in operating
expenses for the year ended December 31, 2012 was primarily driven by higher revenue share and
royalties expenses associated with growth in revenues, higher subscriber acquisition costs related to an
11% increase in gross subscriber additions and subsidies related to increased OEM installations, customer
service and billing costs related to longer average handle times and higher subscriber volume, and higher
sales and marketing costs related to subscriber communications and cooperative marketing.
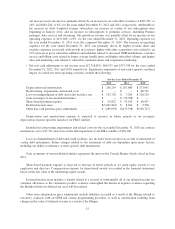
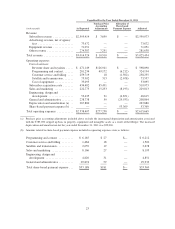
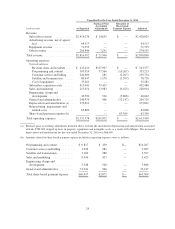
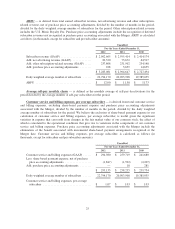
• Net non-cash adjustments to net income were $(2,758,067), $66,975 and $357,743 for the years ended
December 31, 2012, 2011 and 2010, respectively. Significant components of non-cash expenses, and their
impact on cash flows from operating activities, include the following:
For the Years Ended December 31,
2012 2011 2010
Depreciation and amortization ....................... $ 266,295 $ 267,880 $ 273,691
Restructuring, impairments and related costs ............ $ — $ — $ 66,731
Loss on extinguishment of debt and credit facilities, net . . . $ 132,726 $ 7,206 $ 120,120
Gain on merger of unconsolidated entities .............. $ — $ (75,768) $ —
Share-based payment expense ........................ $ 63,822 $ 53,190 $ 60,437
Deferred income taxes .............................. $(3,001,818) $ 8,264 $ 2,308
Other non-cash purchase price adjustments ............. $ (289,050) $(275,338) $(250,727)
Depreciation and amortization expense is expected to increase in future periods as we recognize
depreciation expense upon the launch of our FM-6 satellite.
Included in restructuring, impairments and related costs for the year ended December 31, 2010 are contract
termination costs of $7,361 and a loss on the full impairment of our FM-4 satellite of $56,100.
Loss on extinguishment of debt and credit facilities, net, includes losses incurred as a result of retirement of
certain debt instruments. Future charges related to the retirement of debt are dependent upon many factors,
including our ability to refinance or retire specific debt instruments.
Gain on merger of unconsolidated entities represents the gain on the Canada Merger which closed in June
2011.
Share-based payment expense is expected to increase in future periods as we grant equity awards to our
employees and directors. Compensation expense for share-based awards is recorded in the financial statements
based on the fair value of the underlying equity awards.
Deferred income taxes includes a benefit related to a reversal of substantially all of our deferred income tax
valuation allowance as the cumulative positive evidence outweighed the historical negative evidence regarding
the likelihood that our deferred tax asset will be realized.
Other non-cash purchase price adjustments include liabilities recorded as a result of the Merger related to
executory contracts with an OEM and certain programming providers, as well as amortization resulting from
changes in the value of deferred revenue as a result of the Merger.
15