XM Radio 2012 Annual Report Download - page 70
Download and view the complete annual report
Please find page 70 of the 2012 XM Radio annual report below. You can navigate through the pages in the report by either clicking on the pages listed below, or by using the keyword search tool below to find specific information within the annual report.-
 1
1 -
2
-
3
-
4
-
5
-
6
-
7
-
8
-
9
-
10
-
11
-
12
-
13
-
14
-
15
-
16
-
17
-
18
-
19
-
20
-
21
-
22
-
23
-
24
-
25
-
26
-
27
-
28
-
29
-
30
-
31
-
32
-
33
-
34
-
35
-
36
-
37
-
38
-
39
-
40
-
41
-
42
-
43
-
44
-
45
-
46
-
47
-
48
-
49
-
50
-
51
-
52
-
53
-
54
-
55
-
56
-
57
-
58
-
59
-
 60
60 -
 61
61 -
 62
62 -
 63
63 -
 64
64 -
 65
65 -
 66
66 -
 67
67 -
 68
68 -
 69
69 -
 70
70 -
 71
71 -
 72
72 -
 73
73 -
 74
74 -
 75
75 -
 76
76 -
 77
77 -
 78
78 -
 79
79 -
 80
80 -
81
-
82
-
83
-
84
-
85
-
86
-
87
-
88
-
89
-
90
-
91
-
92
-
93
-
94
-
95
-
96
-
97
-
98
-
99
-
100
-
101
-
102
-
103
-
104
-
105
-
106
-
107
-
108
-
109
-
110
-
111
-
112
-
113
-
114
-
115
-
116
-
117
-
118
-
119
-
120
-
121
-
122
-
123
-
124
-
125
-
126
-
127
-
128
-
129
-
130
-
131
-
132
 |
 |

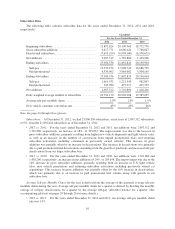
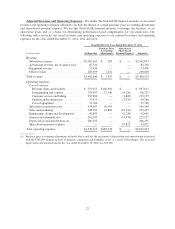
adjusted revenues, partially offset by increases in expenses included in adjusted EBITDA. The increase in
adjusted revenues was primarily due to the increase in our subscriber base and the increase in certain of
our subscription rates. The increase in expenses was primarily driven by higher revenue share and
royalties expenses associated with growth in revenues, higher subscriber acquisition costs related to
increased gross subscriber additions and subsidies related to increased OEM installations, customer
service and billing costs related to longer average handle times and higher subscriber volume, and higher
sales and marketing costs related to subscriber communications and cooperative marketing, partially
offset by lower programming and content costs.
•2011 vs. 2010: For the years ended December 31, 2011 and 2010, adjusted EBITDA was $731,018 and
$626,288, respectively, an increase of 17%, or $104,730. The increase was primarily due to an increase in
adjusted revenues, partially offset by an increase in expenses included in adjusted EBITDA. The increase
in adjusted revenues was primarily due to the increase in our subscriber base. The increase in expenses
was primarily driven by higher revenue share and royalties expenses associated with growth in revenues,
increased customer service and billing expenses associated with subscriber growth and higher subscriber
acquisition costs related to the 12% increase in gross additions, partially offset by lower programming
and content costs.
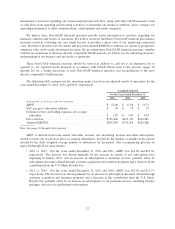
Liquidity and Capital Resources
Cash Flows for the Year Ended December 31, 2012 Compared with the Year Ended December 31, 2011 and
Year Ended December 31, 2011 Compared with the Year Ended December 31, 2010
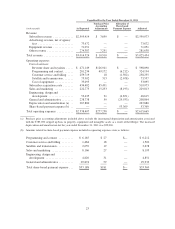
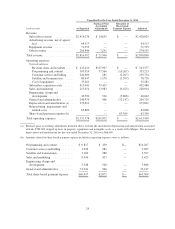
As of December 31, 2012, 2011 and 2010, we had $520,945, $773,990 and $586,691, respectively, of cash
and cash equivalents. The following table presents a summary of our cash flow activity for the periods set forth
below:
For the Years Ended December 31,
2012 2011 2010 2012 vs. 2011 2011 vs. 2010
Net cash provided by operating
activities ................ $806,765 $ 543,630 $ 512,895 $ 263,135 $ 30,735
Net cash used in investing
activities ................ (97,319) (127,888) (302,414) 30,569 174,526
Net cash used in financing
activities ................ (962,491) (228,443) (7,279) (734,048) (221,164)
Net (decrease) increase in cash
and cash equivalents ....... (253,045) 187,299 203,202 (440,344) (15,903)
Cash and cash equivalents at
beginning of period ....... 773,990 586,691 383,489 187,299 203,202
Cash and cash equivalents at
end of period ............ $520,945 $ 773,990 $ 586,691 $(253,045) $ 187,299
Cash Flows Provided by Operating Activities
Cash provided by operating activities increased by $263,135 to $806,765 for the year ended December 31,
2012 from $543,630 for the year ended December 31, 2011. Cash provided by operating activities increased by
$30,735 to $543,630 for the year ended December 31, 2011 from cash provided by operating activities of
$512,895 for the year ended December 31, 2010. The primary driver of our operating cash flow growth has been
improvements in profitability.
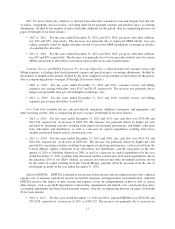
• Our net income was $3,472,702, $426,961 and $43,055 for the years ended December 31, 2012, 2011 and
2010, respectively. Excluding the $3,001,818 non-cash deferred tax valuation allowance reversal in 2012,
14