XM Radio 2012 Annual Report Download - page 89
Download and view the complete annual report
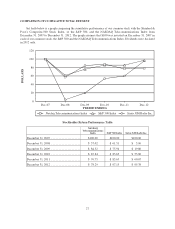
Please find page 89 of the 2012 XM Radio annual report below. You can navigate through the pages in the report by either clicking on the pages listed below, or by using the keyword search tool below to find specific information within the annual report.-
 1
1 -
2
-
3
-
4
-
5
-
6
-
7
-
8
-
9
-
10
-
11
-
12
-
13
-
14
-
15
-
16
-
17
-
18
-
19
-
20
-
21
-
22
-
23
-
24
-
25
-
26
-
27
-
28
-
29
-
30
-
31
-
32
-
33
-
34
-
35
-
36
-
37
-
38
-
39
-
40
-
41
-
42
-
43
-
44
-
45
-
46
-
47
-
48
-
49
-
50
-
51
-
52
-
53
-
54
-
55
-
56
-
57
-
58
-
59
-
60
-
61
-
62
-
63
-
64
-
65
-
66
-
67
-
68
-
69
-
70
-
71
-
72
-
73
-
74
-
75
-
76
-
77
-
78
-
 79
79 -
 80
80 -
 81
81 -
 82
82 -
 83
83 -
 84
84 -
 85
85 -
 86
86 -
 87
87 -
 88
88 -
 89
89 -
 90
90 -
 91
91 -
 92
92 -
 93
93 -
 94
94 -
 95
95 -
 96
96 -
 97
97 -
 98
98 -
 99
99 -
100
-
101
-
102
-
103
-
104
-
105
-
106
-
107
-
108
-
109
-
110
-
111
-
112
-
113
-
114
-
115
-
116
-
117
-
118
-
119
-
120
-
121
-
122
-
123
-
124
-
125
-
126
-
127
-
128
-
129
-
130
-
131
-
132
 |
 |

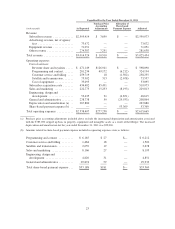
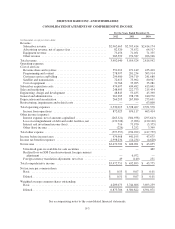
SIRIUS XM RADIO INC. AND SUBSIDIARIES
CONSOLIDATED STATEMENTS OF COMPREHENSIVE INCOME
For the Years Ended December 31,
2012 2011 2010
(in thousands, except per share data)
Revenue:
Subscriber revenue ........................................ $2,962,665 $2,595,414 $2,414,174
Advertising revenue, net of agency fees ........................ 82,320 73,672 64,517
Equipment revenue ........................................ 73,456 71,051 71,355
Other revenue ............................................ 283,599 274,387 266,946
Total revenue ............................................... 3,402,040 3,014,524 2,816,992
Operating expenses:
Cost of services:
Revenue share and royalties ................................. 551,012 471,149 435,410
Programming and content ................................... 278,997 281,234 305,914
Customer service and billing ................................. 294,980 259,719 241,680
Satellite and transmission ................................... 72,615 75,902 80,947
Cost of equipment ......................................... 31,766 33,095 35,281
Subscriber acquisition costs ................................... 474,697 434,482 413,041
Sales and marketing ......................................... 248,905 222,773 215,454
Engineering, design and development ........................... 48,843 53,435 45,390
General and administrative .................................... 261,905 238,738 240,970
Depreciation and amortization ................................. 266,295 267,880 273,691
Restructuring, impairments and related costs ...................... — — 63,800
Total operating expenses ...................................... 2,530,015 2,338,407 2,351,578
Income from operations .................................... 872,025 676,117 465,414
Other income (expense):
Interest expense, net of amounts capitalized ..................... (265,321) (304,938) (295,643)
Loss on extinguishment of debt and credit facilities, net ........... (132,726) (7,206) (120,120)
Interest and investment income (loss) .......................... 716 73,970 (5,375)
Other (loss) income ........................................ (226) 3,252 3,399
Total other expense .......................................... (397,557) (234,922) (417,739)
Income before income taxes ................................... 474,468 441,195 47,675
Income tax benefit (expense) .................................. 2,998,234 (14,234) (4,620)
Net income ................................................ $3,472,702 $ 426,961 $ 43,055
Unrealized gain on available-for-sale securities .................. — — 469
Realized loss on XM Canada investment foreign currency
adjustment ............................................. — 6,072 —
Foreign currency translation adjustment, net of tax ............... 49 (140) 251
Total comprehensive income .................................. $3,472,751 $ 432,893 $ 43,775
Net income per common share:
Basic ................................................... $ 0.55 $ 0.07 $ 0.01
Diluted .................................................. $ 0.51 $ 0.07 $ 0.01
Weighted average common shares outstanding:
Basic ................................................... 4,209,073 3,744,606 3,693,259
Diluted .................................................. 6,873,786 6,500,822 6,391,071
See accompanying notes to the consolidated financial statements.
F-3